Canadian Pension Plan Fund: High-Fee Active Structure Lags Passive Index Benchmark Over Last 5 Years

The Canada Pension Plan Fund (CPP) is one of the two major components of Canada’s public retirement income system, along with Old Age Security (OAS). The CPP mandates that all employed Canadians age 18+ to contribute a certain percentage of their earnings (with an match contributed by their employer) to the CPP, managed by a group called CPPI. (Source: Wikipedia.)

I learned all of this because the CPP has become an interesting example where we can compare an investment manager that has chosen to switch to the high-cost, “we can do better because we are smarter” philosophy: lots of highly-paid employees, lots of highly-compensated hedge fund and private equity managers, lots of fees paid, all in search of higher returns. Luckily, we can see if they succeed because they have to publish their results for all to see.

My sources are two interesting articles and the CPP 2024 Annual Report:

In their fiscal 2024, the CPP paid C$3.5 billion in fees to external investment managers. (The fees paid in 2006 were just C$36 million. As in only C$0.036 billion, 100 times less!) The pension fund itself has grown to over 2,000 employees (up from only 100 employees in 2006), and after adding all operating expenses and transaction costs, the fund’s total expenses now exceed C$5.5 billion annually.

The total assets are roughly C$630 billion. C$5.5 billion of costs on C$630 billion of assets means the fund’s annual expenses eat up 0.87% of the total assets every year. That is creeping very close to 1% of assets annually.

What have those costs bought? Not much so far. In fact, the 5-year performance lag in returns as compared to a passive benchmark portfolio is actually higher than that. The CPP chooses its own Reference Portfolio to match up with their mix of hedge funds and private investments, and it has shifted over the years going from 65% Global Equities/35% Bonds in 2015 to 85% Global Equities/15% Bonds in 2024. (Specifically, 85% MCSI World Index and 15% Canadian government bonds.)

After many pages in the CPP Annual Report explaining their very fancy system and why they believe they will outperform… here’s the one chart that shows their actual value-added. This is their own chart and language.

The CPPI says that we should be okay with this lag, partially because they are so “resilient” during market downturns. This is an often-cited reason for underperformance, but I question it on two levels.

First, with many of these illiquid investments, the values are essentially self-reported. Private REITs always have lower volatility than publicly-traded REITs because they get to report their own net asset value. What’s the value of a building or business that hasn’t actually sold on the open market? Who really knows? Sure, the numbers have to be within reason, but otherwise they are easily fudged. Second, you could have gotten lower volatility by simply holding a little less stocks and a little more bonds. That would have also been more resilient.

I’ve also read the follow-up defense pieces, but I wasn’t really swayed. It’s all the same old stuff. The benchmark wasn’t really a good benchmark (in retrospect), even though they picked the benchmark themselves. Our performance beat our arbitrarily-set target (’cause everything went up), even if it lagged the benchmark. You have to pay up for smart helpers! Don’t you understand?! “I have people skills!”

(Counterpoint: It’s not common, but it can be done with less bloat and lower fees. The Public Employees’ Retirement System of Nevada (NVPERS) is an example of a pension fund that uses low-cost index funds for all of their publicly-traded asset classes. They have two employees. Their overall fees are 0.13%, mostly because they do hold about 12% in private assets. Their trailing 1-year performance as of 9/30/24? 20% annualized. Source.)

Right now, the alarms are not ringing for the CPP because the markets are up a lot and they are generating solidly positive returns even if they lag the market by 1% or 2% annually. I will be on the lookout for future updates on the CPP to see if they can justify their high cost structure over the long run. In the meantime, perhaps Canadian taxpayers should re-read Warren Buffett’s parable warning us about expensive Helpers.
Fidelity Target Allocation ETF Model Portfolios (Meant for Advisors)

One of my older relatives used Fidelity to manage their investments, and it was a hodgepodge of over 10 different mutual funds with a total expense ratio nearing 1%. The last time I measured its long-term performance, it lagged the benchmark indexes by… roughly 1%. Since then, I’ve always viewed that as a big part of Fidelity’s business model. They will sell you a portfolio that looks complex and smart, with fancy-sounding names and lots of moving parts. In the end, your performance will be okay because it will capture most of the stock market return, and most folks won’t even notice the chunk that was missing from fees. From a certain perspective, you paid a fee and got what you wanted: a stamp of approval from a respectable name.
If you’re wondering how Fidelity can offer their excellent customer service and products at such a competitive prices, this is why. There are many people paying additional fees for their various advisory services. I’m okay with that – as a DIY investor I am comfortable turning down their upsell pitches for additional assistance.

So when I saw the ETF.com article Fidelity Debuts All-ETF Model Portfolios for Advisors, I admit that I had my preconceived notions. Would they surprise me? You can view all of model portfolios here. Here is a screenshot with just their moderate risk 60% stock/40% bond portfolio.

The hodgepodge of fancy names is still going strong. It’s like a checklist of industry buzz words: Dynamic Growth, Enhanced, High Dividend, Momentum, Inflation, Multifactor. I find it amusing that Dividend tends to equate to “Value”, which is the opposite of “Growth”. If you own this many different things, how different is it really from just owning the entire stock market?

There still appears to be added complexity just for the sake of looking complex. Is it really helpful to have 2% in the iShares Core Dividend ETF? Or 2% in Cash Sweep? SIX to EIGHT different US bond ETFs???

With a weighted expense ratio of 0.25%, the overall cost is much lower than their active mutual fund portfolios from 10+ years ago. Competition from Vanguard and Blackrock have forced the expense ratios lower across the industry. So while the Fidelity model seems to pretty much the same, it does now come potentially at a lower price. So that’s a good thing.

Some of these Fidelity ETFs are barely a year old, so we can’t do a backtest. I will have to remember to run another comparison 10 years from now between this 60/40 Fidelity ETF portfolio and a simple 3-ETF low-cost index portfolio from Vanguard (42% VTI/18% VXUS/40% BND) or iShares (42% ITOT/18% IXUS/40% IUSB). The low-cost index portfolio have a weighted expense ratio of about 0.04%. Can the Fidelity outperform and justify their higher fees?

Personal Finance Stack: Portfolio Simplification Progress for 2024

I recently found a handwritten note from early 2024 that outlined my goals to “SIMPLIFY!” my portfolio. The overall idea was to make things easier for my spouse to manage in case something happened to me. Even though I still have a rat’s nest of accounts overall, I wanted a streamlined “Core” group of accounts that held 99% of my portfolio. Here’s the current state of the investment side of my personal finance stack.

Vanguard. Vanguard still holds the majority of my investment portfolio, while at the same time has the least amount of transaction activity. The idea is to let it just grow, but also to avoid the need to deal with customer service. Vanguard has the best cash sweep if you don’t use automatic dividend reinvestment. I also want to give the new CEO a bit of time to see how things go.

In 2024, I did convert all my mutual funds into ETFs, so they are easily portable if I do want to move assets. In addition, perhaps the slightly lower ETF expense ratios will make a difference.

Fidelity. Fidelity holds the 2nd-largest total balance, and is where I keep my high-touch accounts. My Fidelity Cash Management Account (CMA) handles most of my monthly cashflows (direct deposit in; BillPay out). My Solo 401k with the manual contributions and ability to buy individual TIPS/Treasuries. My self-directed account with individual stock holdings. In the future, I plan on opening any custodial accounts for kids there.

TreasuryDirect (Sold all Savings Bonds!). A major reason to sell was to achieve simplification and no longer be reliant on the customer service of TreasuryDirect, mostly in for estate planning scenarios. In addition, their policy states that if my account is hacked, they maintain zero liability for any losses. I will miss the additional effective tax-deferred space of savings bonds, but it just wasn’t worth the additional hassle. I just don’t see things improving there in the future, it feels more like gradual decay. This was my 3rd largest balance.

Many of these savings bonds had fixed rates in the 0% to 1%; only a few were at higher fixed rates. The proceeds were reinvested into long-term TIPS (bought/held at Fidelity) with real yields of 2% to 2.6%. Finally, it worked out because the capital gains from this sale were offset from capital losses harvested from selling a bond fund previously when rates rose. (I did an ETF swap to harvest the tax losses while maintaining a similar bond holding without incurring a wash sale.)

Robinhood (setback!). In an unexpected setback for simplification, I ended up transferring my Vanguard IRAs to Robinhood in 2024 due to their 3% transfer promo. When the 5-year hold ends, my plan is to move them to Fidelity unless there is another lucrative offer. This was a new brokerage account to track, but I just couldn’t turn down an additional ~$18,000 in Roth IRA balances.

Utah My529. Thanks to some big early contributions and a very aggressive asset allocation, this is now my next largest investment account, although theoretically it should be completely obliterated within 12 years or so when the tuition bills hit. I consolidated 529 plans several years ago; it can be a lot of paperwork but it’s nice to have everything at one place. Utah seems to be on top of the game for 529 plans.

Bank of America/Merrill Edge to US Bank swap? I keep $100,000 in brokerage assets at Merrill Edge in order to qualify for the Bank of America Preferred Rewards Tier which essentially gets me a flat 2.625% cash back on all my purchases. However, in 2024, US Bank debuted their Smartly credit card that offers up to 4% cash back, also if you keep $100,000 in asset at their brokerage arm.

Should I set up yet another new account at US Bank to take advantage? Should I then close down BofA/Merrill Edge to offset? The problem is that I’m not convinced that US Bank will keep the 4% cash back for very long. US Bank has a history of rolling out new products and then shutting them down abruptly. On the other hand, they also have a history of sometimes keeping the existing perks for grandfathered customers. So maybe it’s best to get in early? Simplification vs. optimization. I didn’t take any action in 2024.

Honestly, as the now-5th largest balance, the BofA/Merrill Edge is the account that I should probably get rid of next, but it’s been so reliable with minimal hassles. I don’t like to mess with what works.

401k Custodians (consolidated with direct 401k-to-401k transfers). These are pre-tax accounts, so I didn’t want to go 401k-to-IRA since then I would have Pre-tax IRAs which would complicate my Backdoor Roth IRA conversions. This makes one less place I have to track my investments. Eventually, if/when our marginal tax brackets are lower, I’d plan to convert some of these accounts to Roth IRAs.

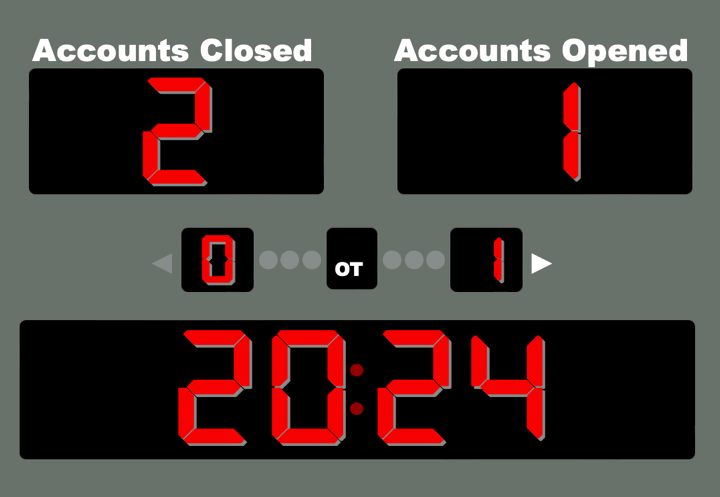
Final score: Two accounts closed (TreasuryDirect and 401k), one account opened (Robinhood).

TastyTrade Referral (Important Correction!)

Update: I’m very sorry, I was in a rush and read the offer wrong. There is no $500 for the referred person. Please don’t open and fund. If I end up getting a $500 reward for referring you, I will send you the $500. However, I don’t have a way of tracking this, so please contact me now if you opened an account with my referral code and have already funded. My recommendation is to not fund – especially due to the long 6-month holding period.

TastyTrade brokerage is offering a $500 double referral offer. However, it is only for the referring person, not the referred.

Berkshire Hathaway 2024 Annual Shareholder Letter by Warren Buffett

Berkshire Hathaway (BRK) released its 2024 Letter to Shareholders (also see full 2024 Annual Report), which Warren Buffett traditionally also uses as an educational instrument. As always, I recommend reading it yourself (only 13 pages total this year). I enjoy reading the letter first (with no spoilers), then peruse the various newspaper and media commentary, and finally re-read the letter again. Here are my personal highlights and commentary.

The total market cap of Berkshire is now over $1 trillion dollars. The total value of their public equity holdings was $272 billion. The total of their cash holdings was $334 billion. The total value of their controlled businesses was about $400 billion.

Berkshire’s businesses are doing fine overall, especially their insurance business. Their controlled businesses just continue to churn out cash, which obviously adds to the cash pile if there are no new investments. BRK parks nearly all of its cash in Treasury Bills, which made a lot of interest in 2024 as compared to the past several years.

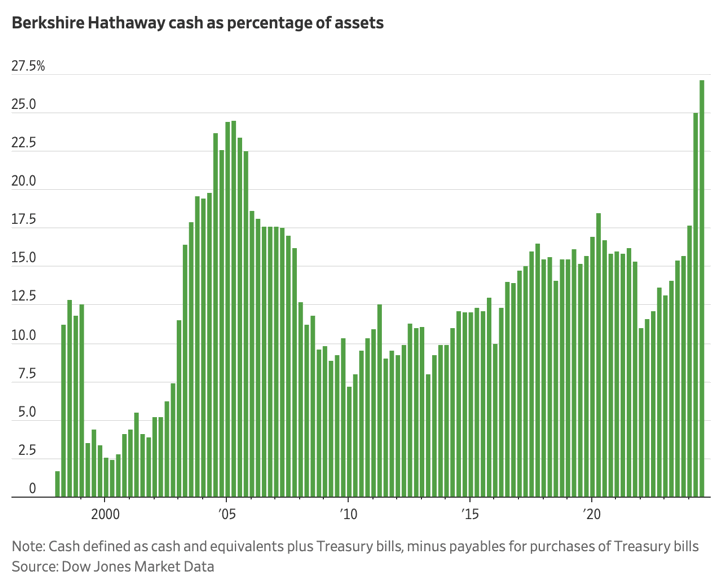
No significant new purchases, in either public or private businesses. Berkshire wants to own great businesses, but only when paying the right price. However, he didn’t give any indication that he thinks folks are completely nuts. On a relative basis, you can judge for yourself with this chart of BRK’s cash as a percentage of assets. Source: WSJ (gift article).

American businesses are still special, although it takes vigilance to stay that way. Berkshire owns some international companies based in Europe and Japan, but it has always been and remains predominantly US-based businesses.

Berkshire shareholders can rest assured that we will forever deploy a substantial majority of their money in equities – mostly American equities although many of these will have international operations of significance. Berkshire will never prefer ownership of cash-equivalent assets over the ownership of good businesses, whether controlled or only partially owned.

Paper money can see its value evaporate if fiscal folly prevails. In some countries, this reckless practice has become habitual, and, in our country’s short history, the U.S. has come close to the edge. Fixed-coupon bonds provide no protection against runaway currency.

Berkshire is not buying Berkshire anymore. BRK has ceased with the buybacks, which means that they are either at or above his estimation of fair value.

Patience and discipline may be the lesson here. Altogether, the letter was a nice, familiar reminder that the things that made Berkshire Hathaway great are still the same. No surprises, no big drama. Right now, valuations are plump so they are holding onto what they already have and other accumulating cash. Berkshire is disciplined enough to do nothing when there is nothing smart to do. I can still hear Charlie Munger saying something to the tune of “It’s not the worst place to be, drowning in cash!”

Perhaps that is the lesson. Everything is at least fairly-valued if not higher. Hold what you have. Let it compound. Be patient. There will be new opportunities eventually.

Past shareholder letter notes.

Vanguard T-Bill/Ultra-Short Treasury ETF, iShares Money Market ETFs Now Live

Vanguard’s new index ETFs that hold short-term US Treasury Bonds are now live (press release).

  • Vanguard 0-3 Month Treasury Bill ETF (VBIL). Tracks the Bloomberg US Treasury Bills 0-3 Months Index, which holds T-Bills with maturities of 3 months or less. Expense ratio of 0.07%.
  • Vanguard Ultra-Short Treasury ETF (VGUS). Tracks the Bloomberg Short Treasury Index, which includes U.S. Treasury Bills, Notes, and Bonds with less than 12 months until maturity. Expense ratio of 0.07%.

Both are the lowest-cost ETF in their respective categories. As a result, I expect they will grow to be popular as now you can access low-cost cash from Vanguard without opening a brokerage account at Vanguard.

For now though, they’ve only been around for several days, so the volume is still relatively low and the bid/ask spreads are relatively high. For now, I am keeping my current favorite cash ETF holding: iShares 0-3 Month Treasury Bond ETF (SGOV) with an expense ratio of 0.09%, close enough for now.

This ETF.com article points out that this is a growing sector for ETFs, with iShares also launching two of the earliest money market ETFs this month:

  • iShares Prime Money Market ETF (PMMF). Actively managed money market ETF. Expense ratio of 0.20%.
  • iShares Government Money Market ETF (GMMF). Actively managed money market ETF. Expense ratio of 0.20%.

These ETFs do not hold only US Treasuries, but instead hold a basket of cash-equivalents that satisfy the strict SEC money market rules under Rule 2a-7 that help to ensure both safety of principal and liquidity in times of market stress. However, this covers a variety of “safe” stuff besides Treasuries so the interest paid out may not be exempt of state and local income taxes. The “Government” money market is more likely to have a higher percentage that qualifies, but when I looked at their holdings there are a lot of various swaps and/or derivatives that probably don’t count as US government obligation interest.

Anyway, interesting that you can buy money market funds as ETFs now. If they are successful, I don’t see why Vanguard wouldn’t enter this sector as well. I’m confident they could beat those expense ratios.

Callan Periodic Table of Investment Returns 2024 Year-End Update

Callan Associates updates a “periodic table” annually with the relative performance of 9 major asset classes over the last 20 years. Above is the most recent snapshot of 2005-2024, which you can find on their website Callan.com. The best performing asset class is listed at the top, and it sorts downward until you have the worst performing asset. I find it easiest to focus on a specific Asset Class (Color) and then visually noting how its relative performance bounces around.

The Callan Periodic Table of Investment Returns conveys the strong case for diversification across asset classes (stocks vs. bonds), capitalizations (large vs. small), and equity markets (U.S. vs. global ex-U.S.). The Table highlights the uncertainty inherent in all capital markets. Rankings change every year. Also noteworthy is the difference between absolute and relative performance, as returns for the top-performing asset class span a wide range over the past 20 years.

Beyond showing the value of diversification, you can still see how performance chasing is hard to avoid. Look at the orange and maroon squares from 2005 to 2010; Emerging Markets Equity and REITs had some crazy-awesome years in the past, and everyone wanted to own them back then. These days, you hardly hear anything. The same could easily end up being true for what has been doing well in the last 5 years – US Large Cap Equity. Or not. Everything is always so much clearer in hindsight!

Best Interest Rates Survey: Savings Accounts, Treasuries, CDs, ETFs – February 2025

Here’s my monthly survey of the best interest rates on cash as of February, roughly sorted from shortest to longest maturities. Banks love taking advantage of our idle cash, and you can often earning more money while keeping the same level of safety by moving to another FDIC-insured bank or NCUA-insured credit union. Check out my Ultimate Rate-Chaser Calculator to see how much extra interest you could earn from switching. Rates listed are available to everyone nationwide. Rates checked as of 2/9/2024.

TL;DR: Liquid, short-term rates slightly lower overall. Longer-term rates actually went up a little; there are 4%+ APY 5-year CDs. Compare against Treasury bills and bonds at every maturity, taking into account state tax exemption. I no longer recommend fintech companies due to the possibility of loss due to poor recordkeeping and lack of government regulation. (Ex. Evergreen Wealth at 5% APY is a fintech.)

High-yield savings accounts
Since the huge megabanks still pay essentially no interest, everyone should at least have a separate, no-fee online savings account to piggy-back onto your existing checking account. The interest rates on savings accounts can drop at any time, so I list the top rates as well as competitive rates from banks with a history of competitive rates and solid user experience. Some banks will bait you with a temporary top rate and then lower the rates in the hopes that you are too lazy to leave.

  • The top saving rates at the moment top out at about what Quontic Bank offers at 4.75% APY (No min). Roger.bank is at 5.00% APY (no min), but does require an additional checking account. I have no direct experience with either, but those are top rates. CIT Platinum Savings is now at 4.30% APY with $5,000+ balance.
  • SoFi Bank is at 3.80% APY + up to $325 new account bonus with direct deposit. You must maintain a direct deposit of any amount (even $1) each month for the higher APY. SoFi has historically competitive rates and full banking features. See details at $25 + $300 SoFi Money new account and deposit bonus.
  • Here is a limited survey of high-yield savings accounts. They aren’t the top rates, but a group that have historically kept it relatively competitive such that I like to track their history.

Short-term guaranteed rates (1 year and under)
A common question is what to do with a big pile of cash that you’re waiting to deploy shortly (plan to buy a house soon, just sold your house, just sold your business, legal settlement, inheritance). My usual advice is to keep things simple and take your time. If not a savings account, then put it in a flexible short-term CD under the FDIC limits until you have a plan.

  • No Penalty CDs offer a fixed interest rate that can never go down, but you can still take out your money (once) without any fees if you want to use it elsewhere. Marcus has a 7mo/13mo No Penalty CD at 4.15% APY with a $500 minimum deposit. Farmer’s Insurance FCU has 9-month No Penalty CD at 4.25% APY with a $1,000 minimum deposit. Consider opening multiple CDs in smaller increments for more flexibility.
  • Abound Credit Union has a 8-month certificate special at 4.75% APY ($500 min). Anyone can join this credit union nationwide with $10 fee. Early withdrawal penalty is 90 days of interest.

Money market mutual funds
Many brokerage firms that pay out very little interest on their default cash sweep funds (and keep the difference for themselves). Note: Money market mutual funds are highly-regulated, but ultimately not FDIC-insured, so I would still stick with highly reputable firms.

  • Vanguard Federal Money Market Fund (VMFXX) is the default sweep option for Vanguard brokerage accounts, which has an SEC yield of 4.27% (changes daily, but also works out to a compound yield of 4.35%, which is better for comparing against APY). Odds are this is much higher than your own broker’s default cash sweep interest rate.
  • Vanguard Treasury Money Market Fund (VUSXX) is an alternative money market fund which you must manually purchase, but the interest will be mostly (100% for 2024 tax year) exempt from state and local income taxes because it comes from qualifying US government obligations. Current SEC yield of 4.26% (compound yield of 4.35%).

Treasury Bills and Ultra-short Treasury ETFs
Another option is to buy individual Treasury bills which come in a variety of maturities from 4-weeks to 52-weeks and are fully backed by the US government. You can also invest in ETFs that hold a rotating basket of short-term Treasury Bills for you, while charging a small management fee for doing so. T-bill interest is exempt from state and local income taxes, which can make a significant difference in your effective yield.

  • You can build your own T-Bill ladder at TreasuryDirect.gov or via a brokerage account with a bond desk like Vanguard and Fidelity. Here are the current Treasury Bill rates. As of 2/7/25, a new 4-week T-Bill had the equivalent of 4.32% annualized interest and a 52-week T-Bill had the equivalent of 4.24% annualized interest.
  • The iShares 0-3 Month Treasury Bond ETF (SGOV) has a 4.27% SEC yield (0.09% expense ratio) and effective duration of 0.09 years. SPDR Bloomberg Barclays 1-3 Month T-Bill ETF (BIL) has a 4.18% SEC yield (0.136% expense ratio) and effective duration of 0.15 years.

US Savings Bonds
Series I Savings Bonds offer rates that are linked to inflation and backed by the US government. You must hold them for at least a year. If you redeem them within 5 years there is a penalty of the last 3 months of interest. The annual purchase limit for electronic I bonds is $10,000 per Social Security Number, available online at TreasuryDirect.gov.

  • “I Bonds” bought between November 2024 and April 2025 will earn a 3.11% rate for the first six months. The rate of the subsequent 6-month period will be based on inflation again. More on Savings Bonds here.
  • In mid-April 2025, the CPI will be announced and you will have a short period where you will have a very close estimate of the rate for the next 12 months. I will have another post up at that time.

Rewards checking accounts
These unique checking accounts pay above-average interest rates, but with unique risks. You have to jump through certain hoops which usually involve 10+ debit card purchases each cycle, a certain number of ACH/direct deposits, and/or a certain number of logins per month. If you make a mistake (or they judge that you did) you risk earning zero interest for that month. Some folks don’t mind the extra work and attention required, while others would rather not bother. Rates can also drop suddenly, leaving a “bait-and-switch” feeling.

  • OnPath Federal Credit Union (my review) pays 7.00% APY on up to $10,000 if you make 15 debit card purchases, opt into online statements, and login to online or mobile banking once per statement cycle. Anyone can join this credit union via $5 membership fee to join partner organization. You can also get a $100 Visa Reward card when you open a new account and make qualifying transactions.
  • Genisys Credit Union pays 6.75% APY on up to $7,500 if you make 10 debit card purchases of $5+ each per statement cycle, and opt into online statements. Anyone can join this credit union via $5 membership fee to join partner organization.
  • La Capitol Federal Credit Union pays 6.25% APY on up to $10,000 if you make 15 debit card purchases of at least $5 each per statement cycle. Anyone can join this credit union via partner organization, Louisiana Association for Personal Financial Achievement ($20).
  • Falcon National Bank pays 6.00% APY on up to $25,000 if you make at least 15 debit card purchases, 1 direct deposit OR ACH credit transaction, and enroll in online statements.
  • Credit Union of New Jersey pays 6.00% APY on up to $25,000 if you make 12 debit card purchases, opt into online statements, and make at least 1 direct deposit, online bill payment, or automatic payment (ACH) per statement cycle. Anyone can join this credit union via $5 membership fee to join partner organization.
  • Andrews Federal Credit Union pays 6.00% APY on up to $25,000 if you make 15 debit card purchases, opt into online statements, and make at least 1 direct deposit or ACH transaction per statement cycle. Anyone can join this credit union via partner organization.
  • Find a locally-restricted rewards checking account at DepositAccounts.

Certificates of deposit (greater than 1 year)
CDs offer higher rates, but come with an early withdrawal penalty. By finding a bank CD with a reasonable early withdrawal penalty, you can enjoy higher rates but maintain access in a true emergency. Alternatively, consider building a CD ladder of different maturity lengths (ex. 1/2/3/4/5-years) such that you have access to part of the ladder each year, but your blended interest rate is higher than a savings account. When one CD matures, use that money to buy another 5-year CD to keep the ladder going. Some CDs also offer “add-ons” where you can deposit more funds if rates drop.

  • KS State Bank has a 5-year certificate at 4.30% APY ($500 minimum), 4-year at 4.30% APY, 3-year at 4.30% APY, 2-year at 4.25% APY, and 1-year at 4.30% APY. $500 minimum. The early withdrawal penalty (EWP) for the 5-year is a huge 540 days of interest.
  • Mountain America Credit Union (MACU) has a 5-year certificate at 4.35% APY ($500 minimum), 4-year at 4.30% APY, 3-year at 4.25% APY, 2-year at 4.05% APY, and 1-year at 4.35% APY. Early withdrawal penalty for the 4-year and 5-year is 365 days of interest. Anyone can join this credit union via partner organization American Consumer Council for a one-time $5 fee (or try promo code “consumer”).
  • You can buy certificates of deposit via the bond desks of Vanguard and Fidelity. You may need an account to see the rates. These “brokered CDs” offer FDIC insurance and easy laddering, but they don’t come with predictable early withdrawal penalties. Right now, I see a 5-year non-callable CD at 4.25% APY (callable: no, call protection: yes). Be warned that both Vanguard and Fidelity will list higher rates from callable CDs, which importantly means they can call back your CD if rates drop later. (Issuers have indeed started calling some of their old 5%+ CDs during 2024.)

Longer-term Instruments
I’d use these with caution due to increased interest rate risk (tbh, I don’t use them at all), but I still track them to see the rest of the current yield curve.

  • Willing to lock up your money for 10 years? You can buy long-term certificates of deposit via the bond desks of Vanguard and Fidelity. These “brokered CDs” offer FDIC insurance, but they don’t come with predictable early withdrawal penalties. You might find something that pays more than your other brokerage cash and Treasury options. Right now, I see a 10-year CDs at [n/a] (non-callable) vs. 4.48% for a 10-year Treasury. Watch out for higher rates from callable CDs where they can call your CD back if interest rates drop.

All rates were checked as of 2/9/25.

Photo by Giorgio Trovato on Unsplash

Morningstar Discussion about The State of Vanguard in 2025 (Highlights)

As a follow-up to my thoughts on Should I Stay with Vanguard? and their recent expense ratio drop announcement, I recently listened to this 30-minute Morningstar video with Daniel Sotiroff and Susan Dziubinski about the current state of Vanguard in 2025. I think it provided some good additional context. Here are some highlights and brief commentary.

Vanguard funds brought in another net $222 billion last year, with the ETFs up $306 billion but the mutual funds losing $84 billion. The Vanguard S&P 500 ETF brought in $117 billion all by itself. Vanguard holds over $10 trillion in assets total. Overall, they are not struggling at all.

However, with the mutual funds following the industry trends and still losing assets, mutual fund holders should be wary of them being forced to sell positions and create capital gains distributions. This includes foremost their actively-managed mutual funds but possibly eventually their Target Retirement 20XX Funds.

Vanguard is rolling out a lot of new bond ETFs. Vanguard Core Tax-Exempt Bond ETF (VCRM), a broad US muni-bond ETF. Vanguard Short Duration Tax-Exempt Bond ETF (VSDM), a short-term US muni-bond ETF. Both ETFs launched November 2024.

Coming in 2025 are the low-cost index ETFs that hold T-Bills: Vanguard 0-3 Month Treasury Bill ETF (VBIL) and the Vanguard Ultra-Short Treasury ETF (VGUS). Then there is Vanguard Short Duration Bond ETF (VSDB), which is actively-managed and will hold short-term bonds across multiple bond sectors.

Vanguard is splitting off their Wealth and Advice division entirely. It will now be completely separate from the Personal Investors division, showing how important it is to the current company. Heading this division will be Joanna Rotenberg, most recently employed at the wealth advice division of Fidelity Investments. As an everyday Vanguard customer, I’m constantly seeing their advice ads to meet with an advisor, but I’m still waiting for them to actually make the product useful. With all these new executives, I guess I’ll have to give them at least another year or two to figure it out. Count me as hopeful on this one.

The new CEO from BlackRock, Salim Ramji, has also stated a desire to focus on helping retires to create income from their portfolios. The drawdown period is another big problem in the industry, which I don’t think anyone else has solved yet either. In fact, creating a stable paycheck is even harder than just growing your portfolio over time and accepting the volatility. Count me as skeptical on this front.

There is an upcoming virtual Joint Special Meeting of Shareholders on February 26, 2025. Sounds like a good example of “Oh, the fund holders own the company and get a say in things!”, but after looking at the fund proxy vote , it looks like the usual nothing-burger. There’s only one real question on the proxy vote card (the second one is “You gonna go to the meeting?”). They’ve already picked the replacement trustees that they want; it’s not like it’s an election where people are running with different platforms. You basically vote for them all, or withhold your vote against them all. Given the huge institutional holders, I don’t even know if every retail investor voted “against all” that it would actually prevent any of their chosen picks from joining the board.

Image credit to Canva AI “HMS Vanguard on hopeful seas at sunrise”

Vanguard ETF & Mutual Fund Expense Ratio Drops (February 2025)

It’s been a while since Vanguard announced a big round of expense ratio cuts, and just in time for their upcoming 50th anniversary, they announced what they call the largest fee cut in Vanguard history spanning 87 funds and projected to save fundholders $350 million this year (effective 2/1/25). In this regard, I am not worried about Vanguard. They know that low costs are core to their identity.

At Vanguard, we believe our funds’ impressive long-term performance owes much to their low costs. For the 10 years ended December 31, 2024, 84% of our funds outpaced the average results of competing funds. The performance of our actively managed fixed income funds has been especially strong: 91% of our active bond funds and 100% of our money market funds have outpaced their peers’ average results.

In fact, I worry that they focus on low costs too much. Cuts are nice, but these expense ratio cuts mean probably 0.01% for the average investor, or $1 a year per $10,000 invested. I’d much rather Vanguard keep the 0.01% and spend it on maintaining a highly-trained, long-tenured staff. There is a palpable difference when talking with a typical Fidelity employee vs. Vanguard employee. I think Vanguard is heading in the right direction, but their staffing still feels much less experienced.

Here are the largest funds and ETFs with expense ratio drops:

I would point out that the ETF version of some of the mutual funds are still slightly cheaper. For example, BND is at 0.03% while VBTLX went from 0.05% to 0.04%. Again, small margins, but you can hold Vanguard ETFs easily at any brokerage and I like that optionality.

Here are a limited sample of funds that I have held in the past that were affected:

  • Vanguard Total International Stock Market (VXUS) lowered to 0.05%.
  • Vanguard Treasury Money Market Fund (VUSXX) lowered to 0.07%.
  • Vanguard California Municipal Money Market Fund (VCTXX) lowered to 0.12%.
  • Vanguard Intermediate-Term Treasury ETF (VGIT) lowered to 0.03%.
  • Vanguard FTSE Emerging Markets ETF (VWO) lowered to 0.07%.
  • Vanguard FTSE All-World ex-US ETF (VEU) lowered to 0.04%.

Here are the current expense ratios on the four broadest ETFs + their classic S&P 500 ETF:

  • Vanguard Total US Stock Market (VTI) at 0.03%.
  • Vanguard Total International Stock Market (VXUS) at 0.05%.
  • Vanguard Total US Bond Market (BND) at 0.03%.
  • Vanguard Total International Bond (BNDX) at 0.07%.
  • Vanguard 500 Index (VOO) at 0.03%.

I find it interesting that one of the last places where the “Vanguard Effect” hasn’t shown up is in money market funds. They still have consistently the best and cheapest default cash sweep money market funds, Treasury money market funds, and Municipal money market funds. They also have some of the best muni funds in general. They are expanding their bond ETFs, but for now access to these alone is a strong reason to stay with Vanguard as a brokerage if you are DIY investor.

Firstrade Brokerage: 3% Match on IRA Contributions, 2% Match on IRA Rollovers

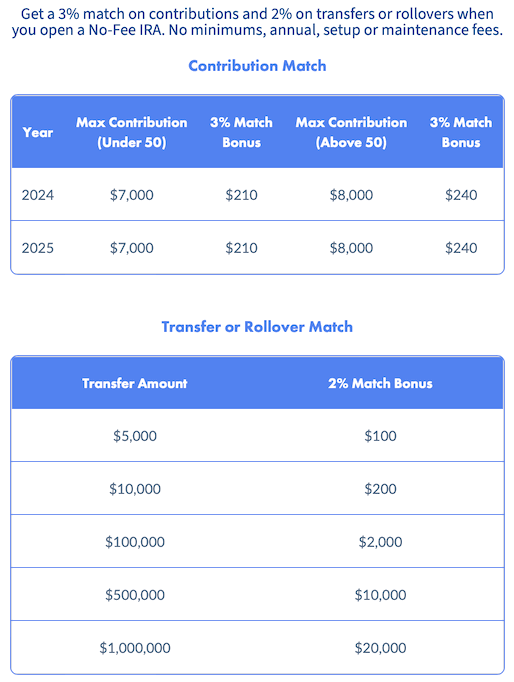
Firstrade is a discount brokerage firm that is smaller but has been around for decades. They have a new IRA match promotion with a 3% match on contributions and a 2% match on IRA transfers and 401k-to-IRA rollovers (up to a $20,000 match amount). They have no minimum balance requirements, no annual fees on the IRA, and they don’t require any premium subscription (like Robinhood Gold). There is a minimum 5-year hold period. You can also get up to $250 in transfer fee rebates for eligible transfers over $2,500. Must open IRA by 2/21/25.

Update: For IRA rollovers, note that the fine print states “Mutual funds and Fixed income products transferred into the account are excluded from the calculation of rewards for this offer.”

More details:

1. Open a Firstrade IRA. Open a Traditional IRA, Roth IRA, or Rollover IRA during the promotion period.

2. Make Contributions or Transfers. Contributions: We’ll match 3% of new contributions made within 30 days of account opening. Transfers: We’ll match 2% of the total amount transferred from another IRA or 401(k) made within 30 days of account opening, up to a maximum of $20,000 match bonus.

3. Earn Rewards. Bonuses are paid 30 days after your new account is approved.

Get a 3% match on contributions and a 2% account transfer boost when you open a Firstrade No-Fee IRA. No minimums, annual, setup or maintenance fees—plus, enjoy commission-free trading on stocks, ETFs, options, and mutual funds.

Promotion Period: Open to U.S. residents who open a new retirement account (Traditional IRA, Roth IRA, or Rollover IRA) between January 21, 2025, and February 21, 2025, and fund the account within 30 days of approval.

This is very similar to the current Robinhood IRA promo, but without the Robinhood Gold requirement that costs $5/month. You may prefer Firstrade as they have a published phone customer service number and a physical branch in Flushing, NY. Customer support is also available in traditional and simplified Chinese, with representatives who speak both Cantonese and Mandarin. Or you may just appreciate that they aren’t Robinhood.

This would be a great offer if Robinhood didn’t already do it first and locked many of us into their 5-year hold period, but then again, if Robinhood didn’t do it first, then Firstrade probably wouldn’t have made this offer.

Vanguard 10-Year Stock Market Forecasts 2025-2035 (+Retrospective)

Vanguard recently released their most recent annual 10-year forecast as of mid-November 2024 (effectively the beginning of 2025). The beginning of the year is the time for forecasts, and that also makes it a good time to remind ourselves how badly they can be wrong and how you shouldn’t really use them for anything.

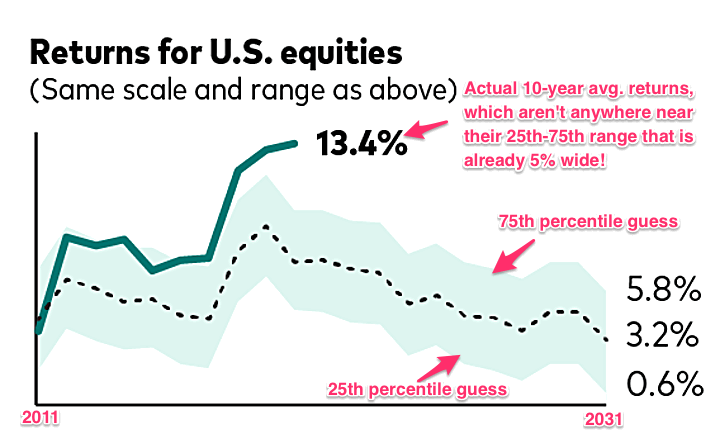
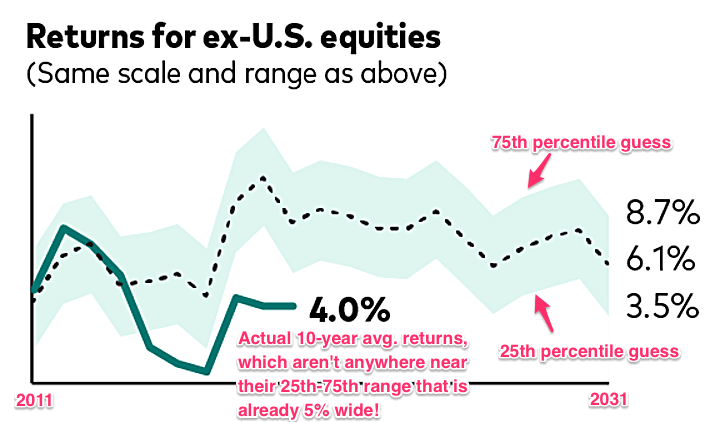
Let’s look back at how those same forecasts performed from 2011-2021, with confidence ranges within the 25th and 75th percentiles. I have some old images saved from when Vanguard gave us an update in 2021.

For US Stocks between 2011-2021, their forecast in 2011 was roughly between 6% and 12% annually for US stocks, for a median around 9%. That a wide band! The actual return? 13.4%. As of early 2025, we are still outside their confidence bands.

For Global ex-US Stocks between 2011-2021, their forecast in 2011 was roughly between 6% and 11% annually for US stocks, for a median around 8.5%. The actual return? 4.0%. As of early 2025, we are still outside their confidence bands here as well.

I’m not trying to pick on Vanguard here, but they do release these things with a certain degree of seriousness and brand authority. But honestly, I wish they wouldn’t. I mean, sooner or later they’ll be correct, but how could you possibly attribute that to skill and not luck?

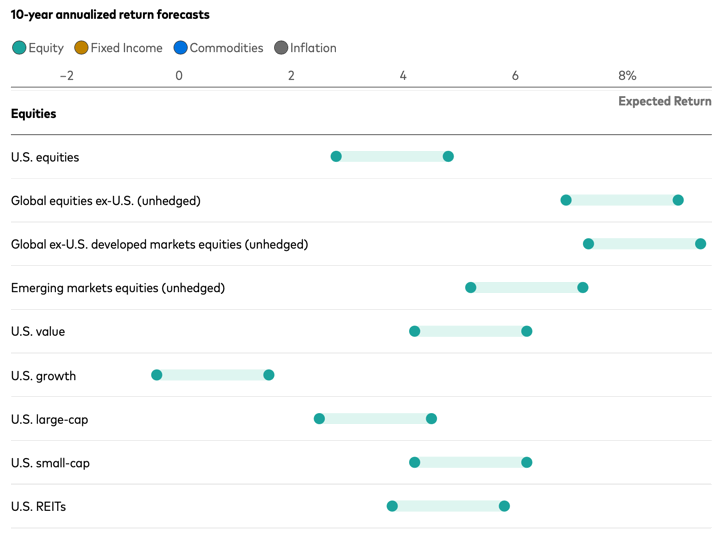
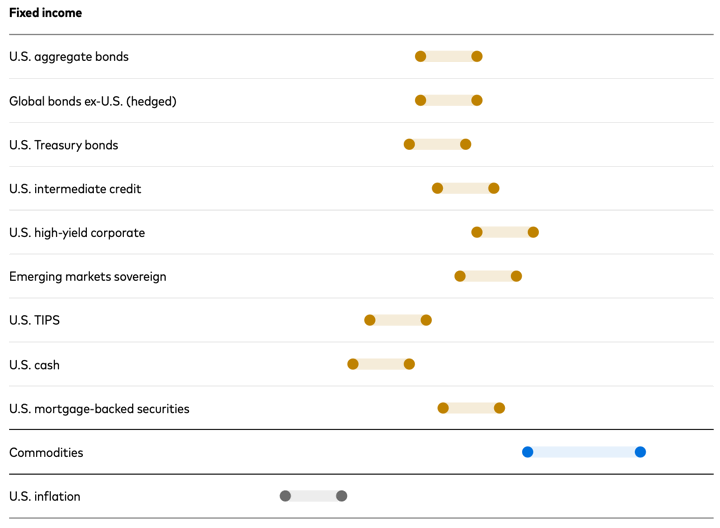
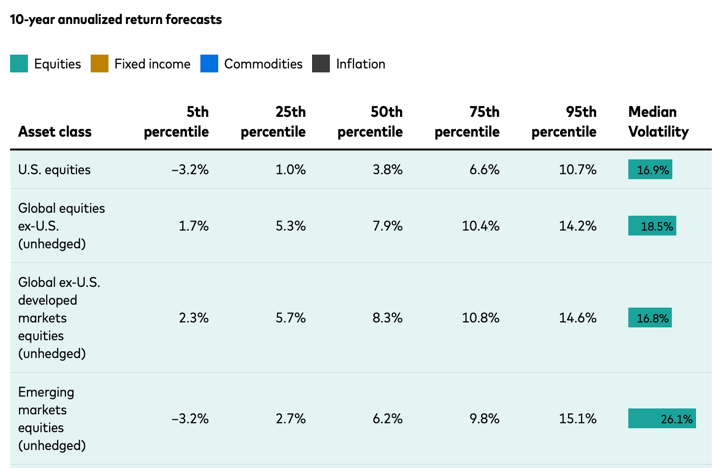
I’m going to include a copy of their late 2024 10-year forecasts (close to the start of 2025) here because they usually delete the post after a couple of years. This way, we can look back again in the future. For this chart, the ranges are their median forecast with a fixed 2% range of confidence for stocks and 1% range for bonds.

Notably, the 10-year median return forecast is 3.8% for US stocks, 7.9% for Global ex-US stocks, and 4.8% for US total bond. This table includes their percentile confidence ranges.

This all reminds of me of the old joke: How can you tell economists have a sense of humor? They use decimal points.