My Bond Portfolio Allocation Explained: Short-Term Treasury ETF

Most people worry about stock drama, but every so often, there is also bond drama. Bonds are debt, which means people worry when there’s an increased chance you won’t get paid back. However, the goal of my bond holdings is to have at least 5 years of expenses safely set aside so that I can comfortably ignore both stock market drama and bond market drama. If you assume a simple 4% withdrawal rate, that means roughly 20% of my portfolio should be in very safe bonds.

“Safe” means that my bonds should have both minimal default risk and interest rate risk. Minimal default risk means ideally either FDIC/NCUA-insured cash or certificates, or US Treasury bonds. Minimal interest rate risk means a relatively short duration.

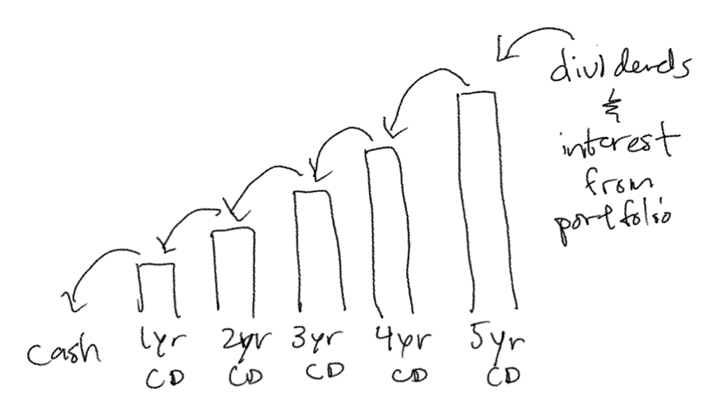
In the idealized “mental model” of my bond portfolio, this is a ladder of 1-year, 2-year, 3-year, 4-year, and 5-year certificates of deposit. Each rung of the ladder is a year of expenses. As each year passes, the 5-year CD will now have 4 years left to mature, the 4-year CD will have 3 years left, and so on, with the 1-year maturing into a liquid savings account. Then, I will take money from my portfolio (mostly dividends and interest) and buy a new 5-year CD. Usually the yield curve is such that a 5-year CD will pay more interest than the savings account, so this ladder earns more interest overall than just keeping it all in the savings account.

In reality, right now US Treasury bonds with their state income tax exemption pay more interest (in my state situation) than other safe options. For example, right now, a 5-year Treasury bond pays ~4.8% interest, but that’s effectively ~5.3% with the state income tax exemption (assuming a 10% state tax rate). There are no 5-year bank CDs that pay ~5.3% a year, even if I went through the hassle of rate-chasing across different credit unions and banks around the nation.

I could build a manual ladder of Treasury bonds, but even better (lazier) is simply buying the Vanguard Short-Term Treasury ETF (VGSH), which maintains a basket of 100% Treasury bonds with an average maturity of 2 years and a low expense ratio of 0.03%. Not exactly the same, but a short-term Treasury ETF is practically very similar to a repeating ladder of US Treasuries of 1 to 5 years. 100% of the interest is considered US government obligations, and so I retain the full state income tax deduction.

For comparison, the 30-day SEC yield today on VGSH is ~4.4%, and with the state income tax exemption that’s an effective ~4.8% for me. Meanwhile, the popular Vanguard Total Bond Market ETF (BND) has a 4.8% 30-day SEC yield but also has higher default risk (holds corporate bonds) and higher interest rate risk (longer duration). BND is fine, but this is why I prefer VGSH. I’m getting the same after-tax return as BND with lower risk. VGIT (intermediate-term Treasury ETF) has a significantly higher average maturity of about ~6 years year, longer than I need and doesn’t pay much higher interest in return.

That’s my long-winded explanation of why ~20% of my portfolio is held in Vanguard Short-Term Treasury ETF (VGSH). The rest of my bond allocation is in TIPS because they guarantee a long-term real return and thus address another risk (inflation risk) directly, but that’s a different topic.
Trump 530A Accounts: Non-Deductible IRA for Kids (Check if you have kids under age 10)

A Trump Account (aka 530A Account, or 530 IRA) is a new type of retirement investment account for children. They offer tax-deferred growth, but you don’t get a tax break upon contribution. Funds generally cannot be withdrawn until the child reaches age 18, whereupon it converts into a traditional IRA with penalties on most withdrawals until age 59.5. Unlike other IRAs, no earned income is required. Beyond parental contributions, there are various ways to receive contributions from the government and outside donors (including employers and nonprofits). The combined annual contribution limit for individuals and employers is $5,000 per child in 2026 (government and outside donors don’t count towards the limit).

Sources for this post are here, here, here, here, and here. My personal takeaway is that they are two main scenarios where you should open an account.

Scenario #1: If you are eligible for free money, you should take action and open an account.

  • Enrollment is not automatic. However, once you open an account, even with $0, outside contributions can arrive directly into your account. There are no annual account fees, so I see no reason not to take the money and let it grow over time until it becomes part of your child’s IRA balance. Your money will be invested in an S&P 500 index ETF (ticker SPYM) and you will need to use an app with BNY and Robinhood software handling the backend.
  • Download the official app. You need to file IRA Form 4547. Practically, you can do everything on the app found at the official site TrumpAccounts.gov. You could also wait until when you file your taxes or through the IRS website.
  • $1,000 Federal-level contribution for young kids and newborns. U.S. citizens born between January 1, 2025, and December 31, 2028, qualify for a one-time federal contribution of $1,000. The money arrives automatically after you open an account.
  • $250 Dell Foundation contribution (~75% of rest of kids under age 10). U.S. citizens born between 2016 and 2024 who live in ZIP codes where the median income is $150,000 or less qualify for $250 from the Dell Foundation. This ends up including ~75% of all kids in that age range. Limited to the first 25 million kids who open an account. Here is an eligibility tool. The money arrives automatically after you open an account.
  • Employer Contributions and/or Matching (Up to $2,500/year). Check with your employer, and look out for new commitments, especially if its a big corporation.
  • State-level Contributions. This list is also growing.
  • Things appear to be changing constantly, including Visa stating they want to enable the ability to redirect your credit card rewards to Trump Accounts.

Scenario #2: If you are already financially set for your own retirement and your children’s educational goals.

  • In general, I take the philosophy that you should worry about your own retirement needs first. If you aren’t very confident you can fund your own retirement, why are you worrying about your kids? This by itself removes the majority of US families.
  • After that, 529 accounts are most likely a better way to save money towards your child’s education. There are tax breaks on contributions in many states, there are more investment options, and the money can be withdrawn tax-free for eligible educational expenses. Even if you over-contribute, you can also now convert up to $35,000 in excess to Roth IRAs.
  • For those financially set enough that they still want to help fund their kids’ retirement beyond that, then this works like a non-deductible IRA contribution to your kids’ retirement. You have to put in after-tax money, it grows tax-deferred, but when it turns into a Traditional IRA at age 18, your kids will owe tax on all capital gains upon withdrawal (taxed as ordinary income).
  • Given that your kids will probably be an a relatively low tax bracket at age 18, this may be a good time to convert from Traditional IRA to a Roth IRA, assuming that is still allowed in the future. Boom, your kid could turn 21 with a six-figure Roth IRA.
  • I figure the folks that are rich enough for this will often be the same folks that were previously funding their kids’ Roth IRA by trying to count their chores or other household tasks as “earning income”. This account isn’t as good as a Roth IRA, but it’s a lot easier to fund.

I was surprised to find out that roughly 75% of children aged 10 and under qualify for the “low-income restricted” Dell $250 contribution, and indeed my zip code was eligible and the $250 has already arrived in my child’s account.

Certified Financial Planner (CFP) Designation is Not a Very High Bar

Last year, I took an official Certified Financial Planner (CFP) course, which satisfies the “Education” requirement of becoming an official Certified Financial Planner (CFP). Mine was online and self-paced at the University of Georgia with a net cost of around $3,000. I did not take the official CFP Exam ($925), nor did I satisfy the “Experience” requirement of 6,000 hours of “professional experience related to the financial planning process”. I don’t want the actual certification ($925 exam + $250 to apply + $575 every year + continuing education costs) – this is just an example of the strange things you can do with “financial independence”. 😜

In the end, I did learn more about several financial topics outside my personal bubble like using a financial calculator, handling estate issues for small business clients, and specific insurance topics. I would be glad that a prospective financial advisor at least had this basic core level of financial knowledge, but a lot of it was “studying for the test” and memorizing specific formulas and facts. It’s basically the equivalent of passing a semester or two of a single college class. I bought the physical textbooks, but passed the tests without opening them at all (just used the class slides). I’m still glad I tried it, otherwise I would still be curious.

The final requirement of a CFP is “Ethics”, which means passing their Candidate Fitness and Standards Background Check. Allan Roth is an experienced fee-only financial advisor whose opinion I respect, and he recently wrote a detailed article about How the CFP Board Sold Out the Public & the Profession. It’s certainly a disappointing read. Basically, the article outlines how the CFP Board is failing in its promise to only certify ethical financial planners. Many CFP holders with regulatory issues get to keep their CFP as long as they keeping paying the dues. “Nearly 1,000 CFPs have some form of criminal disclosure.”

Overall, my impression is that the CFP Board now mainly serves as a business selling the CFP designation to whoever is willing to pay the annual fees and continuing education fees as a signifier to the average person that they are a “educated and vetted financial planner”. They make millions on annual dues, exam prep classes, and continuing eduction tuition. The CFP took advantage of a vacuum, and unfortunately there really isn’t anything better. This means that all financial planners (good or bad) feel pressured to keep their CFP designation, even if they know it doesn’t mean much.

The takeaway is that a CFP designation is a bar, but not a very high bar. Yes, they took some coursework and passed a knowledge exam, although that exam is not nearly as hard as other financial tests like the CFA or CPA exams. Unfortunately, the CFP does not appear to aggressively weed out unethical advisors. The best advisors in the world still probably have a CFP, but many sketchy advisors with past complaints are also flashing their CFP. Be careful out there. If you’re looking for a planner, looking beyond the CFP badge and use BrokerCheck at a minimum, even if the CFP Board doesn’t.

Self-Directed Investors Hold a Lot of Cash. Maybe That’s Perfectly Rational

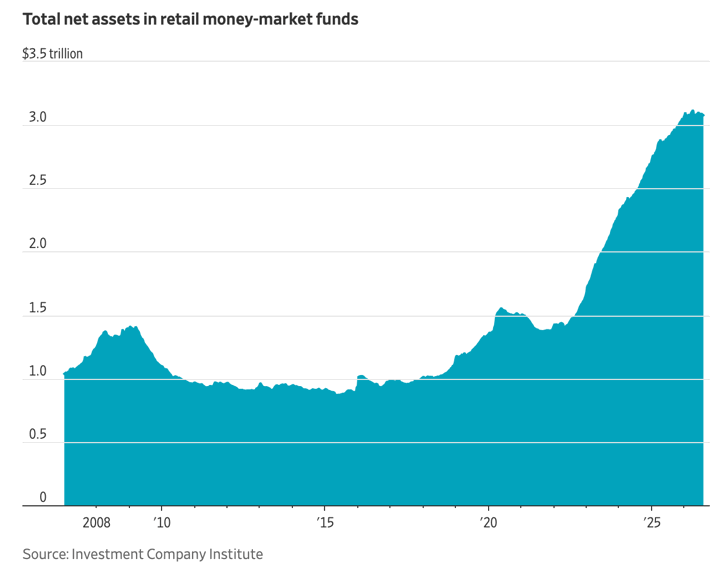
In this Morningstar market brief, it is revealed that the average self-directed Vanguard investor (7 million accounts!) held an asset allocation of 65% stocks, 24% cash, and 10% bonds. That’s a lot more cash than I expected as well.

Then this WSJ article comes up, Wealth Management Has a $3 Trillion Problem: Investors Are Keeping Too Much Cash (gift article). A self-directed investor and former pilot is profiled that keeps 85% in stocks and 15% in a “a money-market fund yielding 3.62%”, which suggests a Vanguard money market fund or another very-low cost money market.

He is keeping 85% of his portfolio in stocks and the rest in a money-market fund yielding 3.62%. Ross looked at historical bear markets and determined they typically don’t last longer than three years. He keeps enough of his portfolio in cash to comfortably get himself through that period, and he sells stocks when he needs to replenish his cash pile.

The rest of the article is about financial advisors thinking this is wrong and suggesting all sorts of alternatives, from muni bonds to private credit to buffer ETFs.

Now wealth and asset managers, eager to prove their worth and in many cases earn more fees, are trying to persuade investors to put it to work. Search for the phrase “too much cash” and you will find numerous articles penned by the likes of JPMorgan Chase and Charles Schwab, warning about the risk of being underinvested.

I found myself siding with the pilot. Maybe an alternative bond fund would give you a slightly higher yield, but the yield curve right now is still not very steep. As long as you are smart with your cash holdings (“cash sort”) and avoid crappy default sweep options with low yield from brokerages (like *cough*, JPMorgan Chase at 0.01% and Charles Schwab at 0.01%!) and instead buying SGOV, VBIL, or a Vanguard money market fund, you won’t be losing that much to a riskier bond alternative. Perhaps that is also partially why the cash allocation of Vanguard investors is so high. Their money market funds are quite good.

Switching to other bonds types can be fine, but be aware of the additional risk you are accepting for that higher yield. You may be taking on principal risk (buffer ETFs can lose money), duration risk (longer-term bonds can lose money), credit risk, or liquidity risk (private credit may limit withdrawals).

Finally, cash is simply a very safe, very short-term bond. Bonds are broken down by maturity, and Treasury bills with under 30 days of maturity are considered cash (“cash equivalents”). I see nothing wrong with taking your risk with stocks and keeping your “bonds” the safest flavor of bonds possible.

Long-term TIPS Yield now 3%; 4.9% Guaranteed 30-Year Withdrawal Rate

Keeping track of TIPS yields is useful because it provides a baseline of the return you can get by taking minimal risk. Beyond just the reliability of US Treasury bonds paying out their interest and return of principal at maturity, TIPS are US government-backed bonds that also address the risk of unexpectedly high inflation.

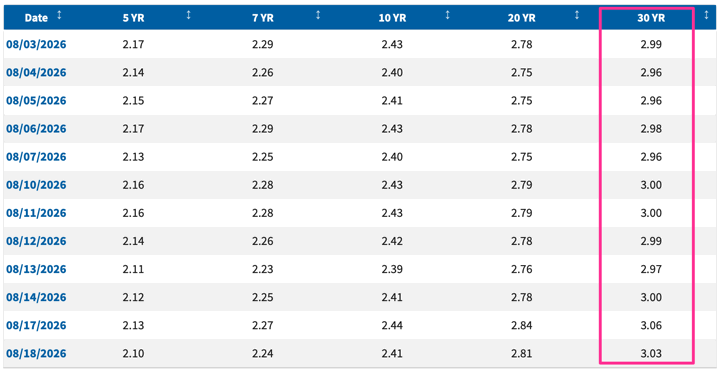
The real yield on 30-year TIPS has been at ~3% for weeks now as of August 2026, which is the first time since 2008, nearly 20 years ago. At the same time, the 30-year regular Treasury is at 5.3%, making the break-even annual inflation rate roughly 2.3%. This situation has motivated a new article by Edward F. McQuarrie and William J. Bernstein, Long TIPS Yield 3%. Time to Buy?. Only 2.3% inflation for the next 30 years? As the authors state, “Good luck with that.”

I would recommend reading it in full for their blunt and snarky writing style, but here are my major takeaways:

  • Long-term TIPS real yields at 3% or above are not common, and they usually don’t last long when they do show up.
  • “Regular” nominal bonds are more likely than not to have a 30-year rolling average real return below 3%. One long-term average provided is only 1.5% real (above inflation). They do sometimes, but it’s not guaranteed and it can be a lot lower than 3%.
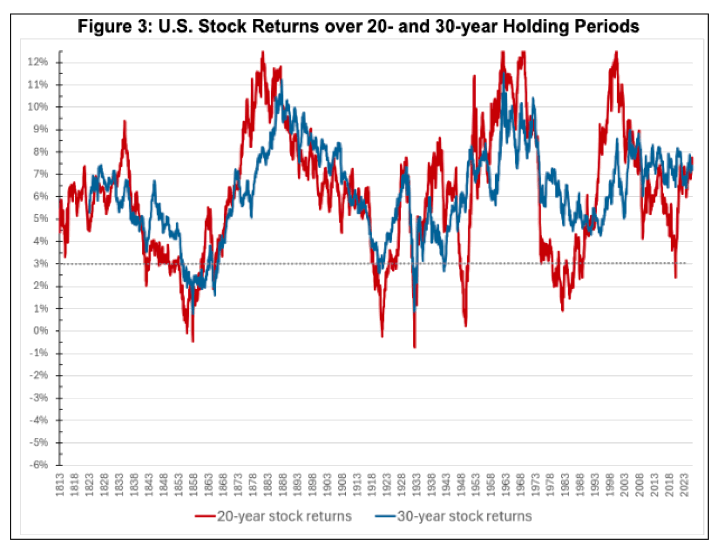
  • Stocks historically do provide 30-year rolling average real returns above 3% (see chart below). But your time horizon must be that long, as the short-term returns can be very different.
  • As a result, this may be a good opportunity for a near-retiree or retiree to lock in some guaranteed, inflation-protected income via a ladder of individual, long-term TIPS. Near-retirees might sell other bonds and buy TIPS. Younger folks should still own mostly stocks.
  • Per TIPSLadder.com, you can currently get a 4.9% real withdrawal rate by building such a ladder. That means with $1,000,000 invested, you can get $49,000 every year in today’s dollars every year for the next 30 years, adjusted upwards each year exactly to match CPI inflation.

What if you live past 30 more years? Remember, you don’t need to put every penny you have into a TIPS ladder. For example, if you carve out just 10% and put it into stocks instead, after 30 years those stocks will have grown quite a lot, most likely enough to fund another 7-10 years of annual income. Or you could split your portfolio up between stocks and TIPS however you like, knowing that the TIPS will provide a stable sleeve of income.

Are You Maximizing Your 401k Employer Match as a Couple?

Here’s an article about the question “Do married couples efficiently allocate their retirement contributions across their retirement accounts?” Since employer match rates differ, even if you both for example set aside 5% of salary, that may not be the most efficient usage of your potential bonus money.

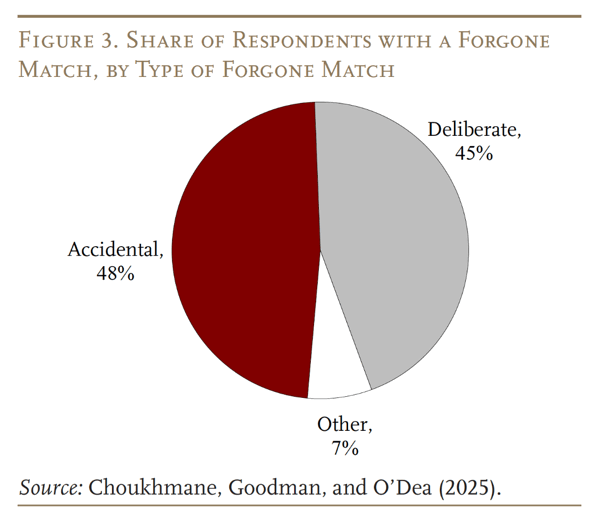
Roughly 20% of couples are not efficiently using their employer match. Of these couples, the average could have earned $757 more in employer match simply by shifting some of the deferral amount from the account of the spouse with the lower match rate to the account of the spouse with the higher one. Legally, retirement account wealth accumulated during marriage is treated as a marital asset that is equally divided in divorce regardless of which spouse made contributions. Practically, perhaps a household with separate finances will prefer keeping 401k balances separate even if happily married? Is that worth the lost money? Perhaps something worth discussing at the next money talk.

Here are their main findings:

– Employer 401(k) matches vary in generosity, so couples can get the most bang for their buck by prioritizing the more generous match.
– But, about 1 in 5 couples leave employer matching money on the table by failing to coordinate their contributions – forgoing $760 per year, on average.
– Half of forgone matches appear to be accidental; the other half reflect deliberate choices related to low marital commitment and/or misperceptions about how assets are treated in divorce.
– These findings suggest that employers and financial advisors could boost couples’ savings by alerting them to the value of coordination.

Is Claiming Social Security Early at 62 Actually the Right Move?

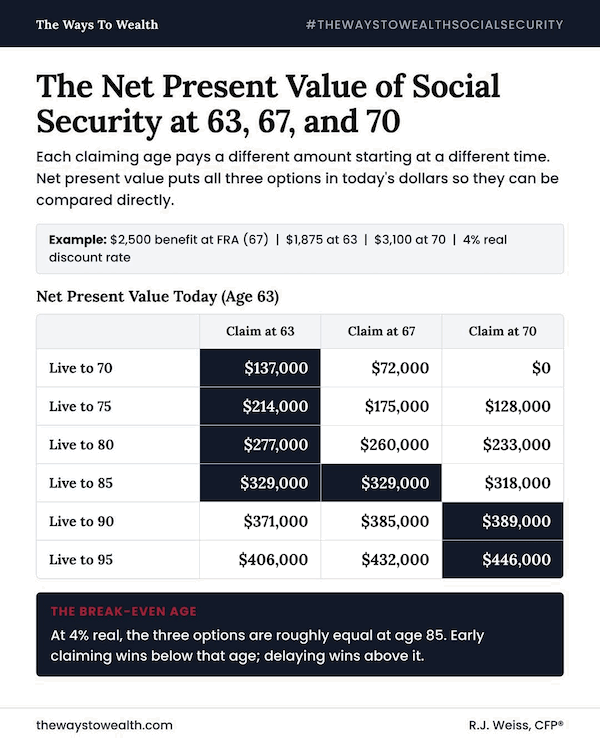
A major retirement decision is when to start claiming Social Security benefits. There are many ways to visualize the decision process, and here is another interesting one based on taking the “Net Present Value”. Essentially, you are taking into account the time value of money to aide your comparison, here assuming a 4% real return (which is both rather optimistic and yet somehow less than what people have received over the last ~10 years).

Source: Ways to Wealth via Early Retirement forum.

If you just go off this chart, you might get a different takeaway than if you used the default answer on free sites like Social Security Optimizer by T. Rowe Price or Open Social Security. Note that the default discount rate for real return is currently 2.7% for Open Social Security; changing this number may alter your results.

People are usually quite willing to accept a discount if they get the money now, and in this case the discount doesn’t even seem that high at less than 10% (again, using the assumptions provided). If you don’t live to 85, claiming at 62 actually puts you ahead.

There are many other factors to consider, like your other income which can increase the tax rates on Social Security income, Roth conversion concerns, spousal situation, health status, and so on. Social Security is still the only way to “purchase” (by waiting to claim) additional income that is both guaranteed to increase with inflation and last for the rest of your lifetime. But if you are retired and in a cashflow crunch, waiting another 5+ years to claim may not be worth the theoretical possible extra money you might get if you live past age 80-85.

MMB Portfolio Dividend & Interest Income – 2026 2nd Quarter Update (July)

Here’s my 2026 2nd Quarter income update as a companion post to my 2026 1st Quarter asset allocation & performance update. Even though I don’t focus on high-dividend stocks or covered-call strategies, I still track the income from my portfolio as an alternative metric to price performance. The total income goes up much more gradually and consistently than the number shown on brokerage statements, which helps encourage consistent investing. Here’s a quote from Jack Bogle (source):

The true investor will do better if he forgets about the stock market and pays attention to his dividend returns and to the operating results of his companies. – Jack Bogle

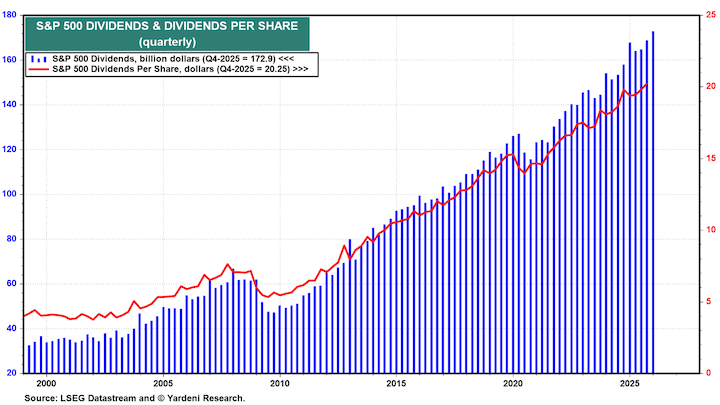
Stock dividends are a portion of profits that businesses have decided to distribute directly to shareholders, as opposed to reinvesting into their business, paying back debt, or buying back shares. They have explicitly decided that they don’t need this money to improve their business, and that it would be better to distribute it to shareholders. The dividends may suffer some short-term drops, but over the long run they have grown faster than inflation.

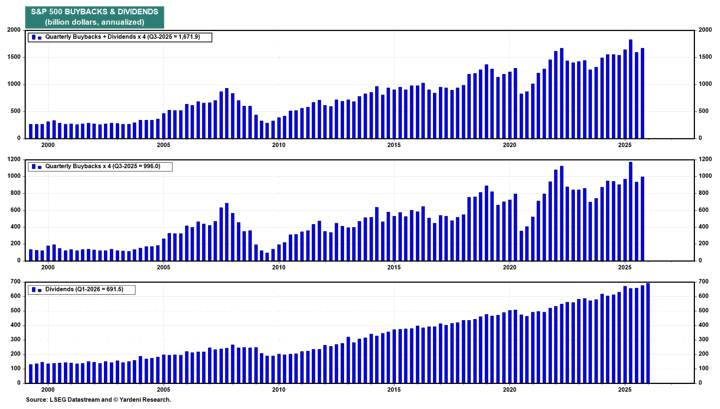
Here is the historical growth of the S&P 500 total dividend, which tracks roughly the largest 500 stocks in the US, updated as of 2026 Q1 (via Yardeni Research):

Admittedly, share buybacks have grown as a popular way to deal with extra cash, as shown in these charts (Yardeni). Many companies like that buybacks are not expected to continue forever, unlike dividends. This helps explain why the dividend yield on the S&P 500 is only around 1% now. This is why I also track the totals of both (buybacks + dividends), also shown below.

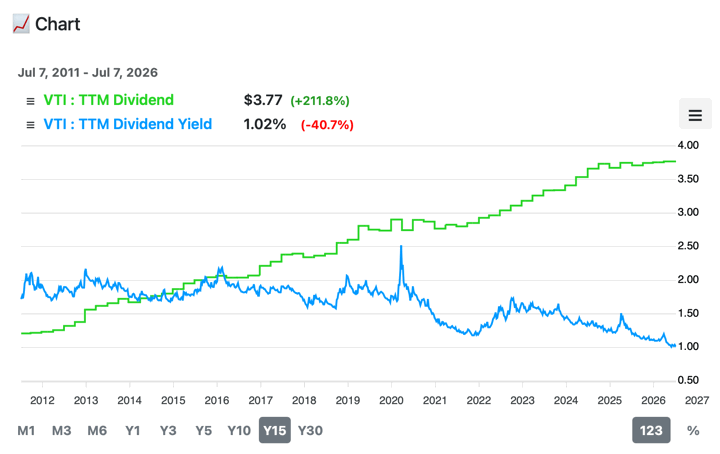
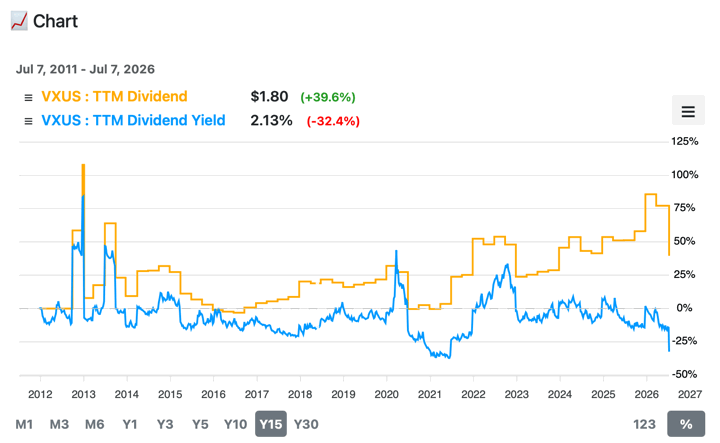
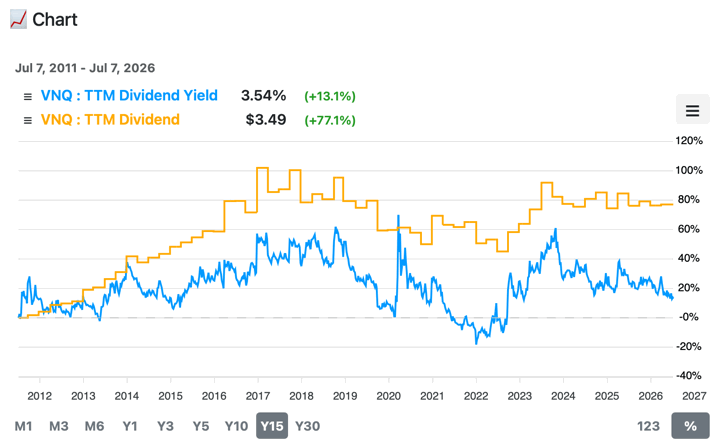
Tracking the income from my portfolio. Three of the primary “trees” that produce “fruit” in my portfolio are Vanguard Total US Stock ETF (VTI), Vanguard Total International Stock ETF (VXUS), and Vanguard Real Estate Index ETF (VNQ).

In the US, the dividend culture is somewhat conservative in that shareholders expect dividends to be stable and only go up. Thus the starting yield is lower, but grows more steadily with smaller cuts during hard times. Companies do buybacks as well, often because they are easier to discontinue. Here is an updated chart of the trailing 12-month (ttm) dividend per share over the last 15 years paid by the Vanguard Total US Stock ETF (VTI) via WallStNumbers.com.

European corporate culture tends to encourage paying out a higher (sometimes even fixed) percentage of earnings as dividends, but that also means the dividends move up and down with earnings. The starting yield is currently higher but may not grow as reliably. Here is an updated chart of the trailing 12-month (ttm) dividend per share over the last 15 years paid by the Vanguard Total International Stock ETF (VXUS).

In the case of Real Estate Investment Trusts (REITs), they are legally required to distribute at least 90 percent of their taxable income to shareholders as dividends. Historically, about half of the total return from REITs is from this dividend income. Here is an updated chart of the trailing 12-month (ttm) dividend per share over the last 15 years paid by the Vanguard Real Estate Index ETF (VNQ).

The dividend yield (dividends divided by price) also serve as a rough valuation metric. When stock prices drop, this percentage metric usually goes up – which makes me feel better in a bear market. When stock prices go up, this percentage metric usually goes down, which keeps me from getting too euphoric during a bull market.

Finally, the last income component of my portfolio comes from interest from bonds and cash. Vanguard Short-Term Treasury ETF (VGSH) and Schwab US TIPS ETF (SCHP) are example holdings, with the actual amount varying with the prevailing interest rates, the real rates on TIPS, and the current rate of inflation.

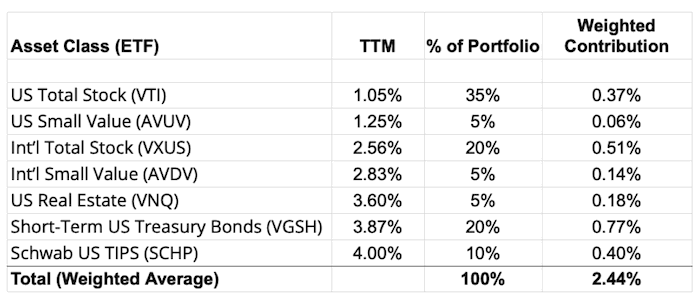
Dividend and interest income yield. To estimate the income from my portfolio, I use the weighted “TTM” or “12-Month Yield” from Morningstar (checked 7/7/26), which is the sum of the trailing 12 months of interest and dividend payments divided by the last month’s ending share price (NAV) plus any capital gains distributed (usually zero for index funds) over the same period. My TTM portfolio yield is now roughly 2.44%.

In dividend investing circles, there is a metric called yield on cost, which is calculated by dividing the current dividend by the original purchase price. In other words, while my portfolio yield today is may be lower than say a target withdrawal rate of 3%, that is because the current market price is also a lot higher. Due to increasing dividends on average over time, my yield-on-cost based on my portfolio value from 10 years ago is over 5%.

What about the 4% rule? For big-picture purposes, I support the simple 4% or 3% rule of thumb, which equates to a target of accumulating roughly 25 to 33 times your annual expenses. I would lean towards a 3% withdrawal rate if you want to retire young (closer to age 50) and a 4% withdrawal rate if retiring at a more traditional age (closer to 65). It’s just a quick and dirty target to get you started, not a number sent down from the heavens!

During the accumulation stage, your time is better spent focusing on earning potential via better career moves, improving your skillset, networking, and/or looking for asymmetrical (unlimited upside, limited downside) entrepreneurial opportunities where you have an ownership interest.

Our dividends and interest income are not automatically reinvested. They are simply another “paycheck”. As with our other variable paychecks, we can choose to either spend it or invest it again to compound things more quickly. You could use this money to cut back working hours, pursue a different career path, start a new business, take a sabbatical, perform charity or volunteer work, and so on. You don’t have to wait until you hit a magic number. Our life path has been very different because of this philosophy. FIRE is Life!

MMB Portfolio Asset Allocation & Performance – 2026 2nd Quarter Update (July)

Here is my 2026 2nd Quarter portfolio update that includes 401k/403b/IRAs and taxable brokerage accounts but excludes our house and small side portfolio of self-directed investments. Following the concept of skin in the game, the following is not a recommendation, but a sharing of our real-world, imperfect DIY portfolio.

“Never ask anyone for their opinion, forecast, or recommendation. Just ask them what they have in their portfolio.” – Nassim Taleb

How I Track My Portfolio
Here’s how I track my portfolio across multiple brokers and account types:

  • The Empower Personal Dashboard real-time portfolio tracking tools (free) automatically logs into my multiple accounts, adds up my various balances, tracks my performance, and figures out my overall asset allocation across the entire portfolio. Formerly known as Personal Capital.
  • Once a quarter, I also update my manual Google Spreadsheet (free to copy, instructions) because it helps me calculate how much I need in each asset class to rebalance back towards my target asset allocation. I also create a new sheet each quarter, so I have a personal archive of my portfolio dating back many years.

2026 2nd Quarter Asset Allocation and YTD Performance
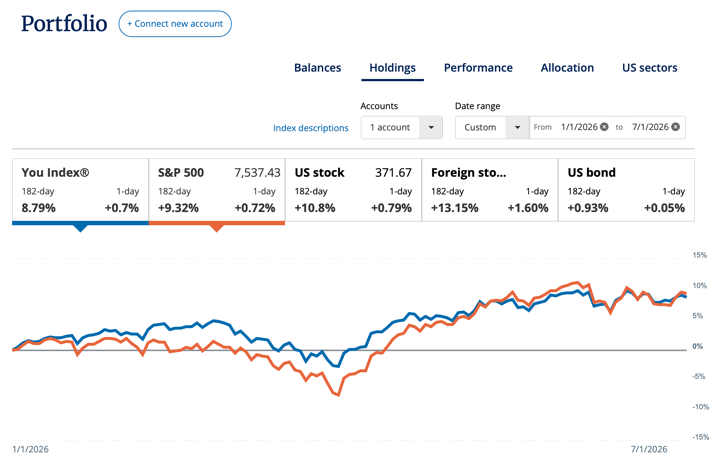
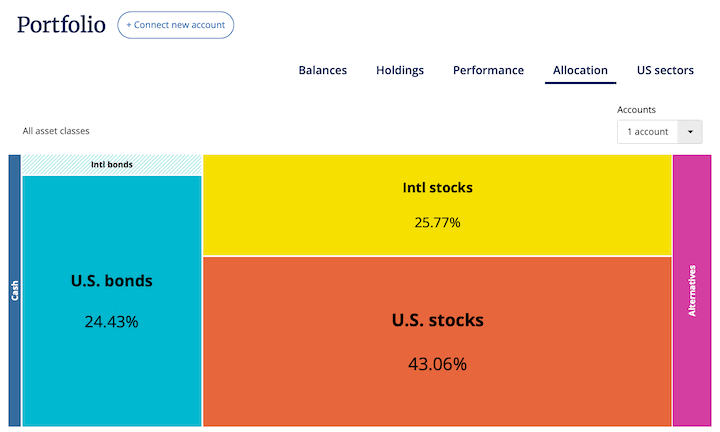
Here are updated performance and asset allocation charts, per the “Holdings” and “Allocation” tabs of my Empower Personal Dashboard.

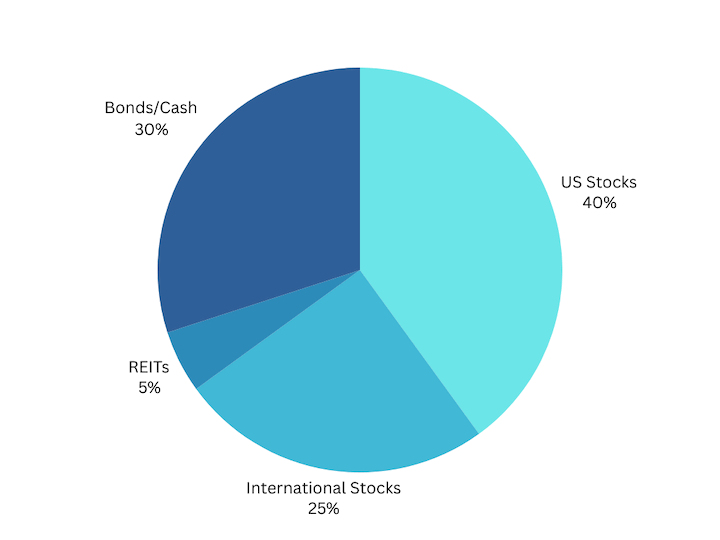
The major components of my portfolio are broad index ETFs. I do mix it up a bit around the edges, but not very much. Here is a model version of my target asset allocation with sample ETF holdings for each asset class.

  • 35% US Total Market (VTI)
  • 5% US Small-Cap Value (AVUV)
  • 20% International Total Market (VXUS)
  • 5% International Small-Cap Value (AVDV)
  • 5% US REITs (VNQ)
  • 20% US “Regular” Treasury Bonds and/or FDIC-insured deposits (VGSH)
  • 10% US Treasury Inflation-Protected Bonds (SCHP)

Big picture, the target is 70% businesses and 30% very safe short-term bonds/cash:

By paying minimal costs including management fees, transaction spreads, and tax drag, I am trying to essentially guarantee myself above-average net performance over time.

I do not spend a lot of time backtesting various model portfolios. You’ll usually find that whatever model portfolio is popular at the moment just happens to hold the asset class that has been the hottest recently.

The portfolio that you can hold onto through the tough times is the best one for you. I’ve been pretty much holding this same portfolio for 20 years. Check out these ancient posts from 2004 and 2005. Every asset class will eventually have a low period, and you must have strong faith during these periods to earn those historically high returns. You have to keep owning and buying more stocks through the stock market crashes. You have to maintain and even buy more rental properties during a housing crunch, etc. A good sign is that if prices drop, you should feel the urge to buy more of that asset instead of less. I don’t have strong faith in the long-term results of commodities, gold, or bitcoin – so I don’t own them.

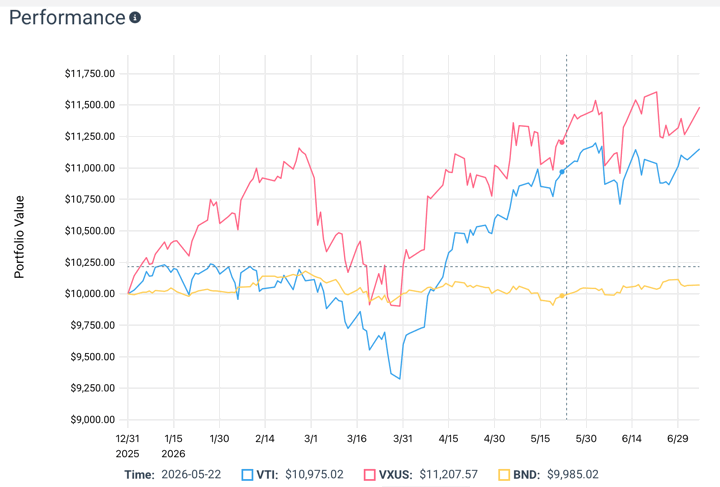
Performance details. Here’s an updated YTD Growth of $10,000 chart courtesy of Testfolio for some of the major index ETFs (total US stock, total international stock, total US bond) that shows the difference in performance in the broad indexes:

First quarter of 2026, the US broad indexes (VTI) dropped, but came back and then some in the 2nd quarter. International stocks (VXUS) are slightly ahead for the year. I’m getting a bit too stock-heavy so will be directing rebalancing funds towards bonds. I’ll share about more about the income aspect in a separate post.

Investing in US Stocks Has Been Quite Rewarding

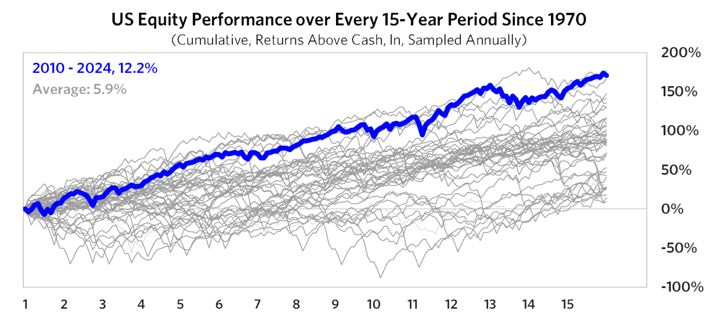
What’s on my mind these days? Here’s one thing. Based on this Bridgewater article, out of any 15-year period to be invested in US stocks dating back to 1970, the one we’ve just lived through was the best (2010 through end of 2024).

I was a bit surprised to see this. I’m disappointed that the same chart for growth in average inflation-adjusted worker income does not look the same at all. What does it mean for the future? I have no idea. Maybe our economic system is just tilted towards rewarding businesses instead of the average worker now, and high performance will be the norm. Maybe the next 15 years will have horrible performance, but the average worker will earn a much better relative income. Will AI simply reward the huge corporations even more, or will we find a way to distribute the benefits?

Vanguard: Recommended Strategies for Maximizing Retirement Income

Vanguard Research recently released a whitepaper titled Vanguard’s Principles for Retirement Income (direct PDF link) and I was surprised to find it rather substantial – almost a short book on retirement income planning that provides valuable insight into their (growing!) financial advisory services. The focus is clearly about creating a sustainable income from your portfolio, not the usual stuff about growing your portfolio.

Focusing on income rather than account balances can lead to clearer decision-making in retirement.

Without a defined income plan, investors may spend too cautiously or risk drawing down their assets too quickly. With an income-focused framework, you can better understand how to turn your savings into spending by having a clearer view of:

– How much you can withdraw over time.
– How long your assets may need to last.
– How different risks can affect outcomes.

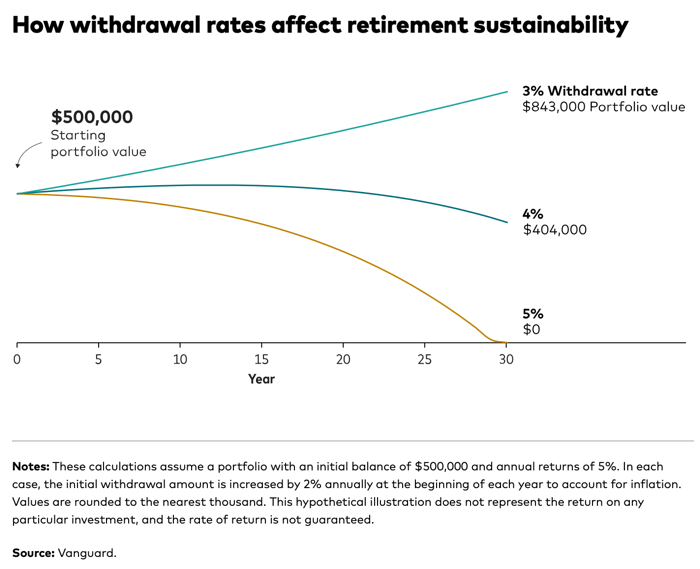
As a start, you have your sources of guaranteed income (pensions, annuities, Social Security) and roughly 3.5% to 4% of your portfolio, based on historical numbers:

Here are some of the recommended strategies to help stretch things further to create enough income for the rest of your lifetime. Some are more for those that really need to make some big, hard decisions in order to not run out of money, while others are more about marginal improvements.

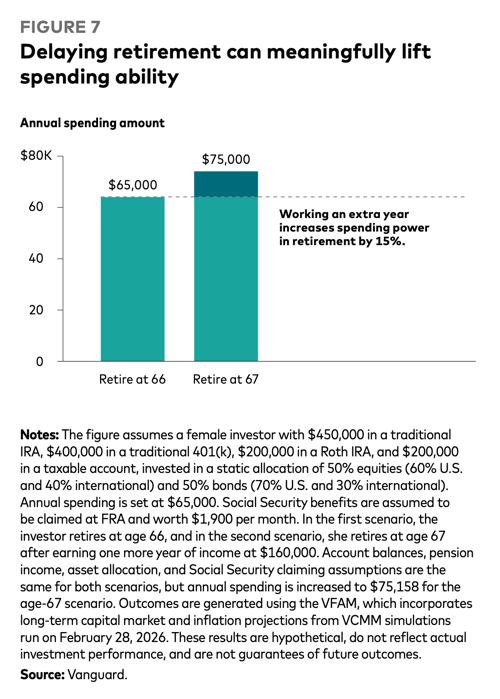
  • Work longer. Not ideal, but powerful. You earn more, you also delay the start of Social Security claiming, and you have a shorter retirement period to cover.
  • Dynamic spending. Rather than a fixed percentage withdrawal rate, dynamic spending extends the life of the portfolio by reducing withdrawals if there are poor market returns. There are many ways to implement this.
  • Convert some assets to SPIA (single-premium income annuity). If you need to support a hard floor in your income to support essentials, an SPIA can help provide the reliable income needed.
  • Tapping home equity. Something to consider if necessary to provide for essentials, especially later in retirement.
  • Roth conversions. Converting tax-deferred investments to Roth when your marginal tax brackets are lower (like right after you stop working) can reduce your overall tax paid.
  • Tax-efficient withdrawal strategy. In general, you should withdraw from taxable accounts
    first, then tax-deferred, then save Roth for last.

If anything, this paper provides some good places to dig deeper when the time comes.

Still Buying the Haystack and Sleeping Well Because I’ll Own The Needles (Winners)

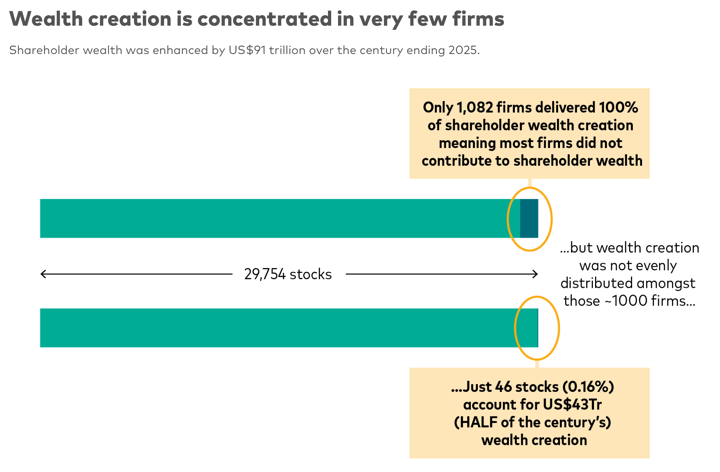
In 2019, I wrote the post Buying The Haystack: Sleeping Well Because I’ll Own The Winners (Needles). Recently, Hendrik Bessembinder updated his previous research with the paper One Hundred Years in the U.S. Stock Markets (SSRN/PDF), which tracked the “investment outcomes for 29,754 common stocks listed on the public U.S. stock markets over the 100-year period from 1926 to 2025”. Some highlights:

  • Total Net Wealth created over that period: ~$91 Trillion.
  • The 0.2% Needles: Just 46 stocks (roughly 0.2% of the ~30,000 total stocks) were responsible for generating 50% of that $91 trillion.
  • The 4% Needles: Only 4% of all stocks accounted for 100% of the net value creation. The other 96% collectively just matched risk-free US Treasury bills – many were complete or nearly complete losses, the rest had smaller gains that only just offset those losses. This means that the top 4% created all of the net wealth creation.

Here is a chart that summarizes this info from a Vanguard Australia article Equity market skewness: The few mega-winners and the case for diversification:

I will simply quote Bogle and myself now, because I am lazy and honestly that’s how investment writing works. You just end up repeating and/or repackaging the same 10-25 rules over and over again.

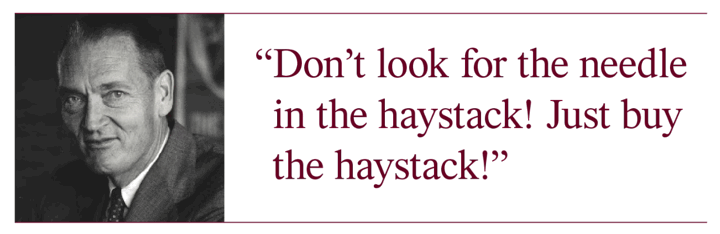
As the late Jack Bogle told us: “Don’t look for the needle in the haystack. Just buy the haystack.”

I don’t know which will be the most successful US companies in the future, but I know that I will own them via the total US index fund in my portfolio. I will own the next Amazon, Google, Facebook, Apple, or Visa. I’ll also own whoever disrupts them after that. Since I own a big chunk of global stocks inside the Vanguard Total International Stock Index fund, I’ll be covered if they come from the other side of the world.

In 2026, this means I own NVIDIA/Alphabet/Google/Microsoft, but in 10 years, I know that the picture will be at least somewhat different.