 One of the perpetual debates in retirement planning circles is withdrawal rates, AKA how much monthly income can you take from a portfolio. Once you nail down a withdrawal rate and retirement spending target, then you get Your Number – how much you need to have saved to retire (after backing out Social Security and other income streams). It’s common to start with the static 4% rule, but that rule also includes some drawbacks. An alternative is a flexible withdrawal rule that adjusts based on market returns. When your portfolio grows, you can spend a little more. If it shrinks, you cut back a little. Sounds reasonable, right?
However, I haven’t seen many real-world examples of flexible withdrawal rules. Schwab has helpfully outlined one proposed method in this memo: Lifetime Adjustable Income vs. the 4% Rule: Can You Spend More in Retirement with Less Risk? This provides the underlying basis behind their robo-advisor feature called Intelligent Income where you can pick a comfort level and the software will tell you how much you can withdraw each year and from which type of account (IRA, Roth IRA, taxable, etc).
In this memo, we compare a flexible withdrawal strategy to the static 4% rule. We recommend a lifetime adjustable income strategy, described in this paper, that can be put into action using an annually updated financial plan, using technology or an advisor. Doing so may help increase spending early in, and over a long, retirement and help ensure your money lasts.
Here’s their example structure for flexible withdrawals:
- Set an initial withdrawal rate that delivers an 80% probability of success (savings lasting).
- Adjust spending amounts after each year based on if the probability of savings lasting falls outside the range you decide: here it is below 75% or above 99%. If these thresholds are crossed, increase or decrease spending by the amount that brings the financial plan back to a 99% probability of savings lasting. This results in fewer but more drastic cuts.
- Add “guardrails”. A minimum and maximum acceptable annual (real) spending amount of $25,000 and $60,000, respectively, meaning that we will always withdraw at least $25,000 (or at most $60,000).
Using these flexible rules, the initial withdrawal rate was about $43,000 instead of $40,000. Across all of the simulated scenarios, the average annual withdrawal was basically 20%, or $10,000 a year, higher: $50,000 a year instead of the $40,000 a year (in today’s dollars). Even better, the likelihood of running out of money dropped.
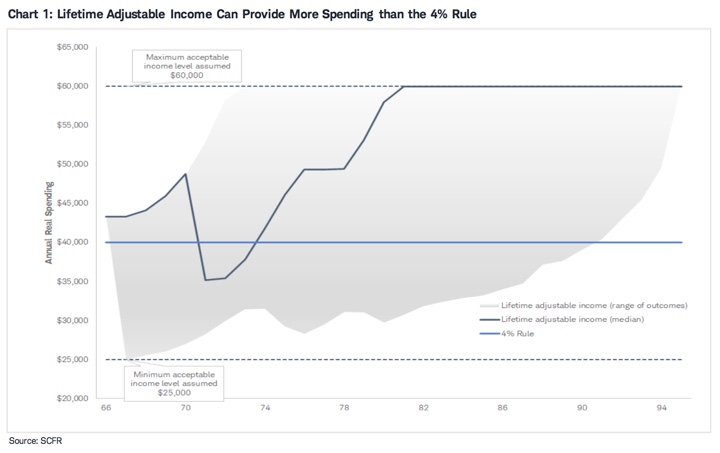

However, you must look past the averages and see that you are now exposed to the extremes. Look at that wide expanse of grey. A significant number of the scenarios involved some extended deep cuts to spending, hitting and hovering just above the $25,000 minimum guardrail. You’ll have to decided if you like this trade-off between probably getting more income but possibly enduring some big cuts. This is why many financially-conservative people would prefer to simply start out at a lower 3% or 3.5% withdrawal rate and adjust upwards if the portfolio keeps growing.
In any case, I found it interesting that Schwab used the probability of portfolio survival rate as the factor used to adjust withdrawal rate. DIY investors can implement a similar system themselves. Here are some tools to estimate portfolio survival probability:
- Vanguard has a very simple one.
- cFIREsim and FIREcalc allow you to enter a variety of variables manually.
- Personal Capital remembers and tracks my actual portfolio and updates this number automatically. That part is free but also offers an optional paid financial advice tier.

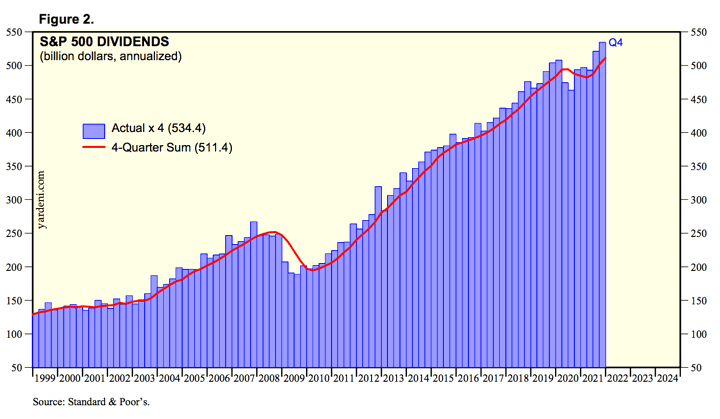
 Here’s my (late) quarterly update on the income produced by my “

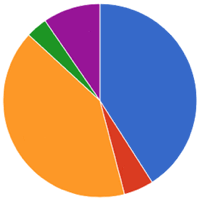 Here’s my (late) quarterly update on my current investment holdings, as of 1/23/22, including our 401k/403b/IRAs and taxable brokerage accounts but excluding a side portfolio of self-directed investments. Following the concept of
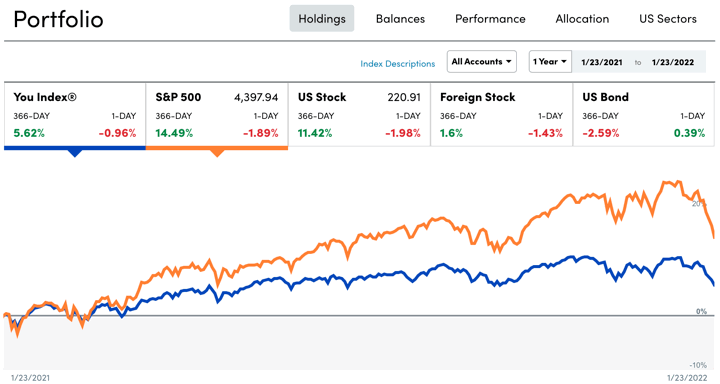
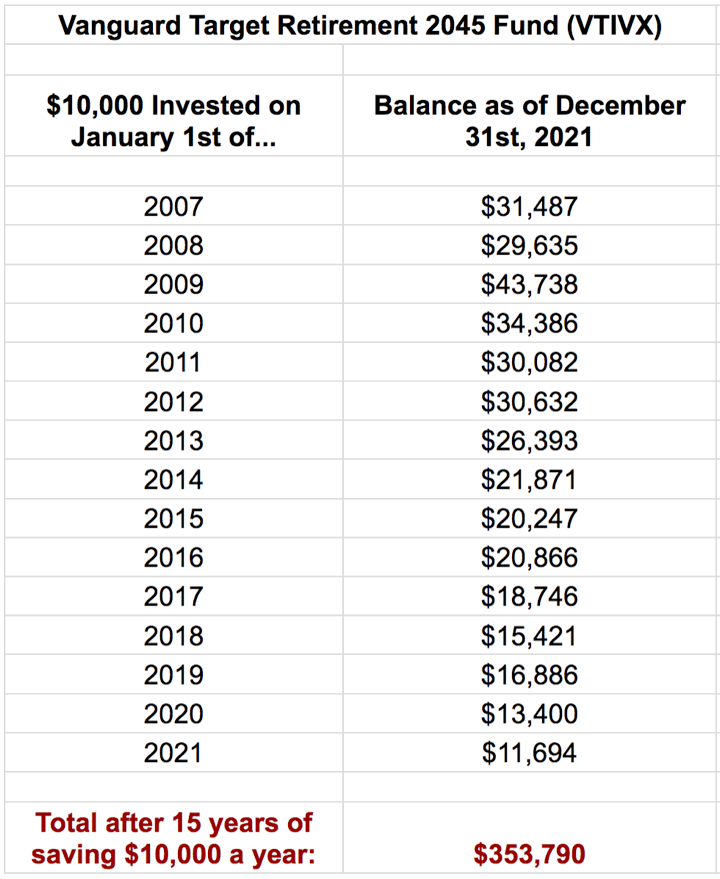
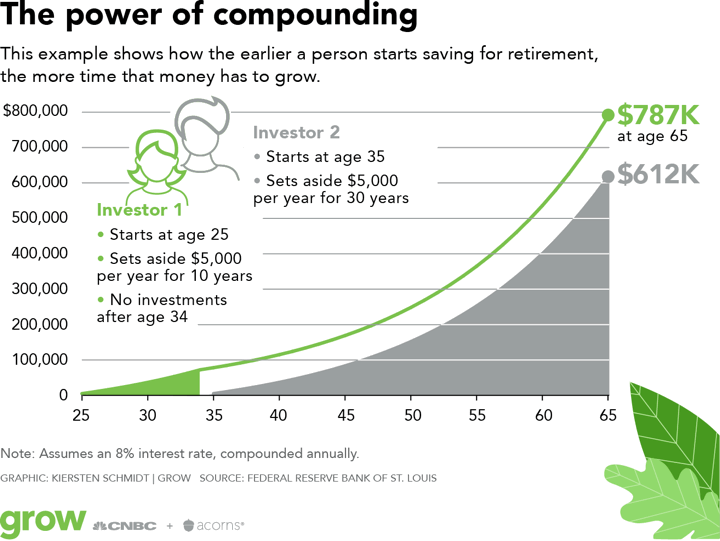
 Instead of focusing on the current hot thing, how about stepping back and taking the longer view? How would a steady investor have done over the last decade? Most successful savers invest money each year over a long period of time.
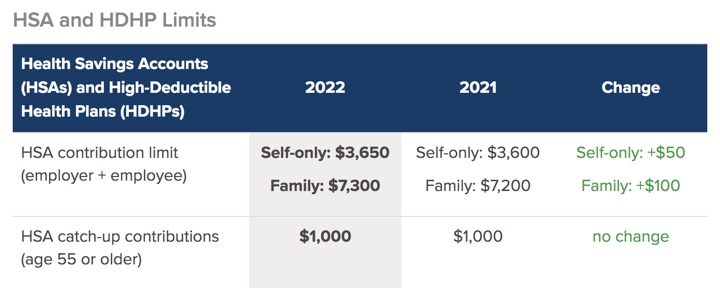
 The beginning of the year is a good time to check on the new annual contribution limits to the various available retirement accounts. Our income has been quite variable these last few years, so I regularly adjust the paycheck deferral percentages based on expected income for the year. This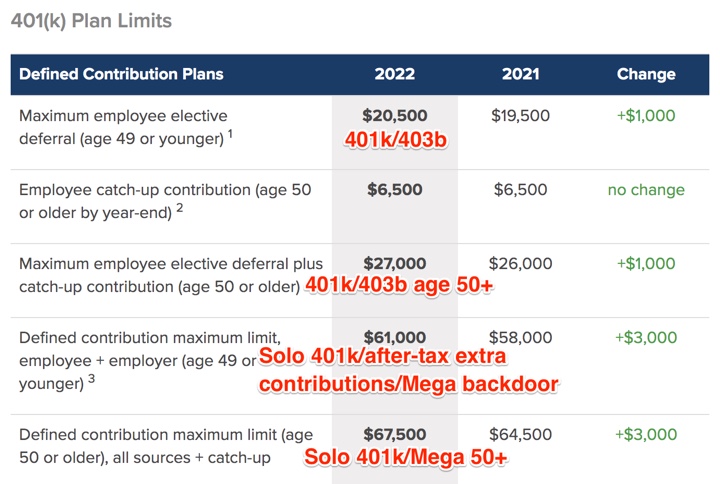
 The Vanguard Target Retirement Funds are one of the largest “set-and-forget” mutual funds that own a mix of stocks and bonds that automatically adjust over time based on your targeted retirement year, with combined assets across the institutional and retail classes of over $600 billion.


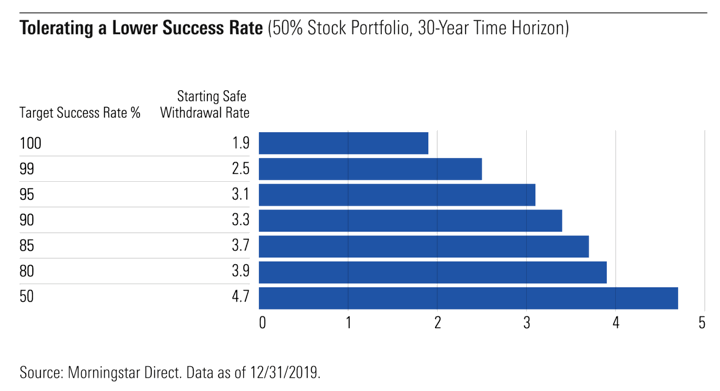
 Financial freedom seekers usually have a Number – the value at which their investments can support their spending indefinitely. This is directly linked to “safe withdrawal rates”. For example a 4% safe withdrawal rate is a 25x multiplier – meaning $30,000 in spending needs not covered by Social Security, annuities, or pensions would require 25 x $30,000 = $750,000. Morningstar recently released a 59-page research paper called


 Some investors like to break down their portfolio into several different asset and sub-asset classes. One long-standing example of the “slice-and-dice” is the “
 Savings I Bonds are a unique, low-risk investment backed by the US Treasury that pay out a variable interest rate linked to inflation. With a holding period from 12 months to 30 years, you could own them as an alternative to bank certificates of deposit (they are liquid after 12 months) or bonds in your portfolio.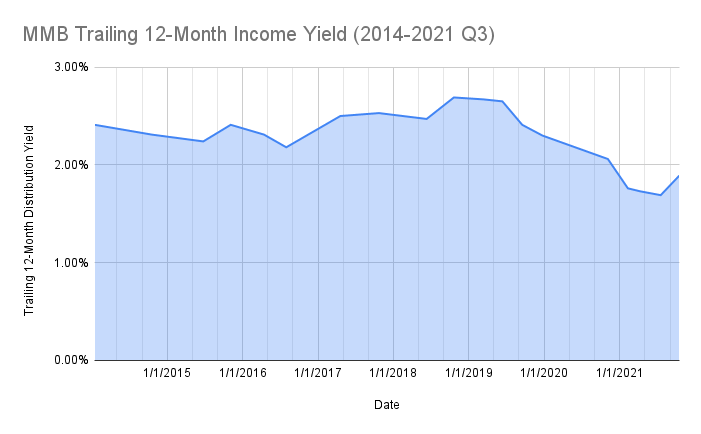

 The Best Credit Card Bonus Offers – 2026
 Big List of Free Stocks from Brokerage Apps
 Best Interest Rates on Cash - 2026
 Free Credit Scores x 3 + Free Credit Monitoring
 Best No Fee 0% APR Balance Transfer Offers
 Little-Known Cellular Data Plans That Can Save Big Money
 How To Haggle Your Cable or Direct TV Bill
 Big List of Free Consumer Data Reports (Credit, Rent, Work)